 matplotlib Animation
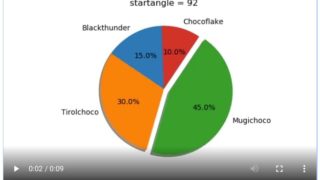
 [matplotlib animation] 28. 回転する円グラフ
matplotlib FuncAnimationによる回転する円グラフのアニメーション
matplotlib Animation 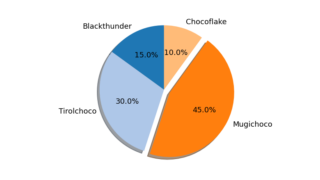 matplotlib
  matplotlib
  その他
その他  その他
その他  matplotlib Animation
  matplotlib
  matplotlib