 matplotlib
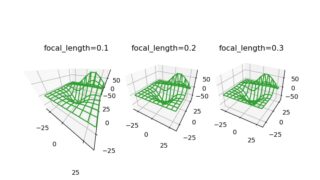
 [matplotlib animation] 111. 3D plotでfocal lengthを変えた時の見た目の変化
Matplotlibの3.6.0から追加されたfocal length機能を変化させたときの3Dプロットの見え方の変化をアニメーションで解説。遠近感やパースペクティブの違いを視覚的に理解できる実用的なチュートリアル。
matplotlib 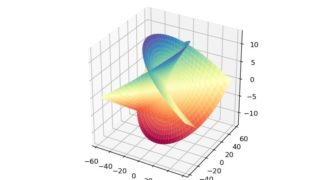 matplotlib
 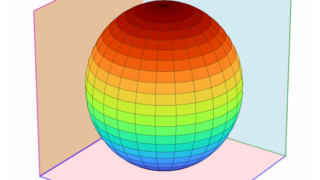 matplotlib 3D
  matplotlib 3D