NumPyに関すること
 matplotlib
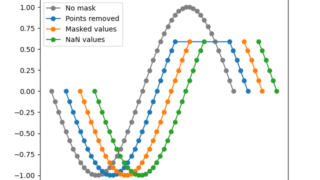
 [matplotlib] 125. マスク値とNaN値を含むデータのプロット
Matplotlibを使って欠損値(マスク値やNaN値)を含むデータを効果的に可視化する方法を解説。データ点の削除、マスク処理、NaN値設定の3つのアプローチを比較し、それぞれの視覚的な違いを示します。
 matplotlib
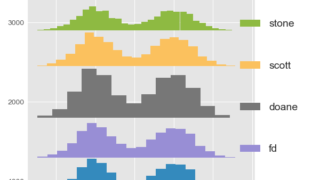
 [NumPy] 13. ヒストグラム用のbinsをnp. histogram_bin_edgesで作成
NumPyの histogram_bin_edges 関数を使用してヒストグラムのビン(区間)を作成する方法を解説。データ分析の柔軟性を高めるための実践的なアプローチを紹介します。
 matplotlib
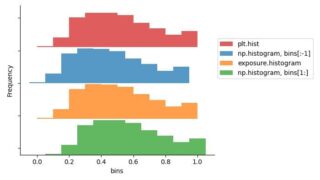
 [scikit-image] 107. skimageで画像のヒストグラムを作成する(exposure. histogram)
scikit-imageのexposure.histogram関数を使った画像ヒストグラム作成方法を解説。画像の明るさ分布を視覚化し、skimage、numpy、matplotlibのヒストグラム関数の比較も含む。画像処理や分析に役立つ基本テクニックを紹介。
 matplotlib
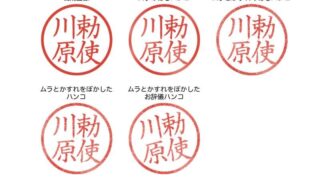
 [scikit-image] 106. scikit-imageで作成する自然な印鑑画像
scikit-imageを使って印鑑画像を生成する方法を解説。filters.gaussianでにじみ効果を加え、transform.rotateで角度をつけ、ノイズ処理でかすれを表現。本物のような質感を持つデジタル印鑑の作り方をPythonコードで紹介します。
 matplotlib
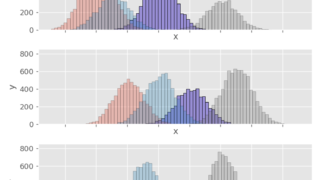
 [matplotlib] 98. ヒストグラムのalphaを調整して視認性を高める
複数のヒストグラムを重ねて表示する際にalpha値を調整することで、重なり合った分布の視認性を高め、データの比較をより効果的に行う方法を解説します。Matplotlibを使った実践的な透明度設定のテクニックを紹介します。
 matplotlib
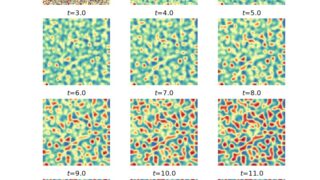
 [SciPy] 15. 偏微分方程式を有限差分法で解く
SciPyを用いて反応拡散系の偏微分方程式(フィッツフュー-南雲モデル)を有限差分法で数値的に解く方法を解説します。境界条件の設定から時間発展の計算まで、Python実装の詳細を説明します。
 matplotlib
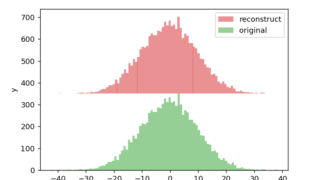
 [NumPy] 12. ヒストグラムからデータを再構築する方法
NumPyを使用したヒストグラム作成と元データの再構築手法について解説。正規分布データからヒストグラムを生成し、そのビン情報から統計的に同等なデータセットを再現する方法を詳しく説明します。
 matplotlib
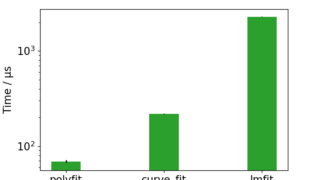
 [SciPy] 8. np.polyfit, curve_fit, lmfitによる線形近似の実行速度比較
NumPyのpolyfit、SciPyのcurve_fit、lmfitライブラリを使用した線形近似の実行速度を比較検証した記事。各手法のパフォーマンス特性を解説し、matplotlibによるエラーバー付き棒グラフで視覚化しています。