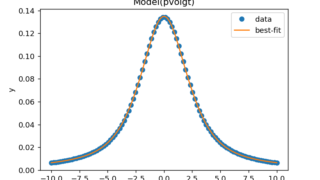
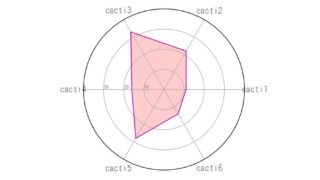
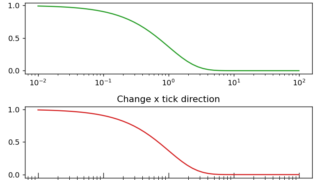
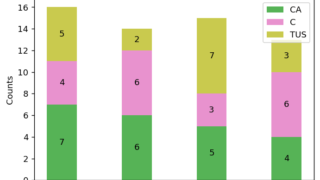
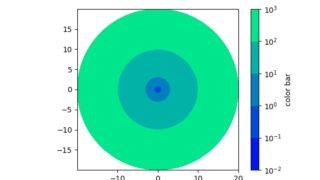
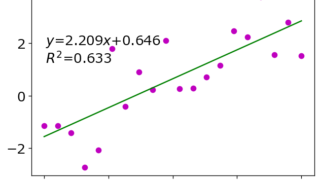
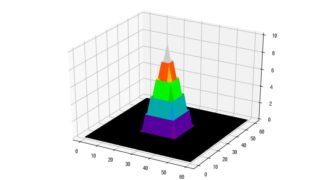
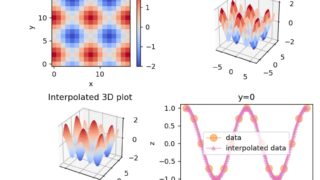
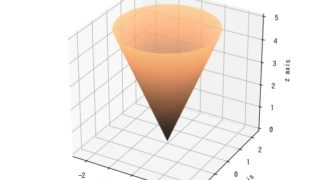
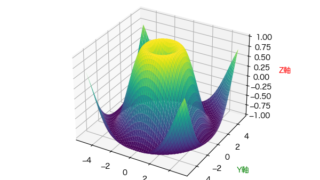
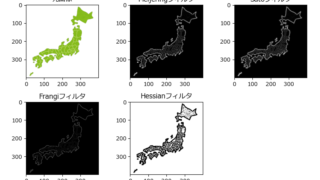
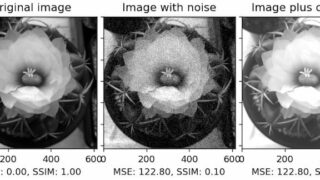
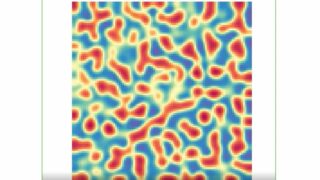
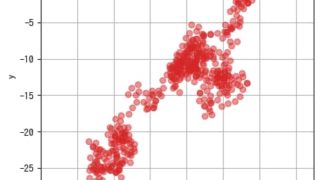
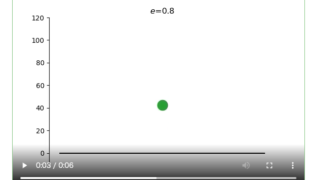
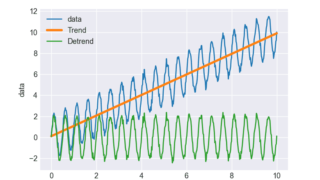
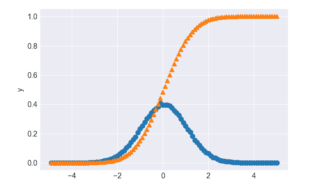
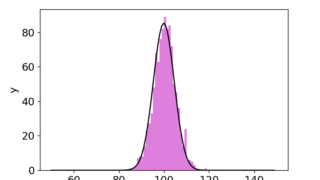
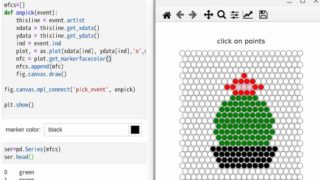
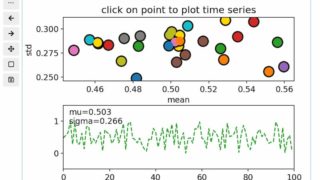
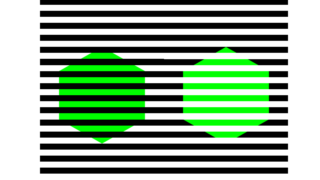
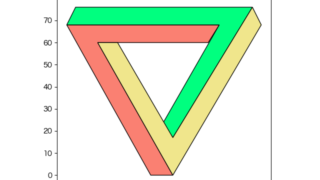
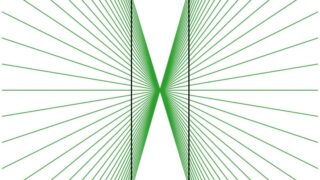
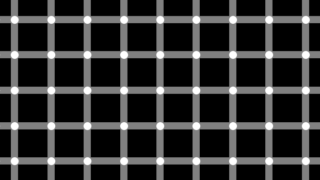
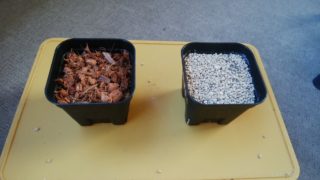
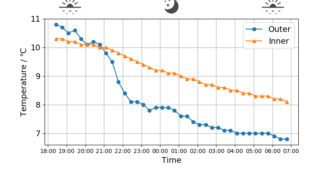
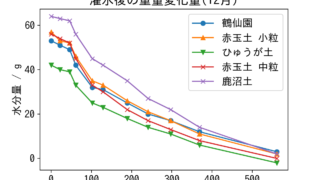
Examples 2020.01.172025.08.15 [lmfit] 21. 擬フォークト分布関数モデルによるカーブフィッティング 2021.02.192025.09.17 [matplotlib] 32. レーダーチャート 2019.04.302025.09.09 [matplotlib] 117. 目盛りの細かい調整(ax.tick_params) 2022.03.092025.09.17 [matplotlib] 102. bar_labelで棒グラフにデータラベルを表示 2021.04.292025.09.17 [matplotlib] 40. 等高線、カラーマップにおけるログスケールのカラーバー 2019.07.292025.09.17 [SciPy] 1. Scipyのcurve_fitで最小2乗法近似、決定係数R2も求める 2018.10.032025.09.17 [SciPy] 7. SciPyで画像処理: ndimage.morphology.distance_transform_edtを使った背景からの距離計算 2019.11.122025.09.17 [SciPy] 11. interp2d関数を用いた2次元データの補間方法 2020.12.052025.09.17 [matplotlib 3D]37. 円錐(Cone)の作成方法 2018.12.022025.08.14 [matplotlib 3D] 10. matplotlibの3Dグラフにおける軸ラベルのオフセット(間隔)設定方法 2018.10.112025.08.27 [matplotlib 3D] 14. 3Dグラフの回転アニメーション 2018.10.252025.09.01 [matplotlib 3D] 20. 極座標系の3D surfaceプロット 2018.10.172025.08.15 [scikit-image] 13. filters.meijeringなどを用いたリッジ検出 2019.05.062025.08.27 [scikit-image] 23. 画像の細線化処理(morphology.skeletonize) 2019.06.132025.09.17 [scikit-image] 63. 大津の方法による画像の3値化(skimage.filters threshold_multiotsu) 2020.02.062025.09.16 [scikit-image] 51. 画像の局所的な極大値を検出(skimage.feature peak_local_max) 2019.09.252025.09.17 [scikit-image] 54. ラベリングした領域のサイズ、角度、重心などの測定(skimage.measure regionprops) 2019.09.282025.09.17 [scikit-image] 30. 画像の構造類似性(skimage.measure compare_ssim) 2019.07.052025.09.17 [matplotlib animation] 100.反応拡散系によるチューリングパターン 2021.02.262025.09.03 [matplotlib animation] 65. 2次元ランダムウォークアニメーション 2019.12.102025.09.10 [matplotlib 3D] 14. 3Dグラフの回転アニメーション 2018.10.252025.09.01 [matplotlib animation] 81.バウンドするボール 2020.06.072025.09.05 [matplotlib animation] 1. プロットのマーカーを画像としてアニメーション表示 2018.11.152020.03.23 [matplotlib animation] 37. 3Dグラフの縦回転アニメーション 2019.05.172025.08.28 [seaborn] 10. violinplotを使ってカテゴリデータの分布を可視化する方法 2020.03.162025.09.17 [seaborn] 15. 線形回帰つき散布図をregplot,lmplotで表示 2020.03.252025.08.20 [ipywidgets] 24. Dropdownを活用したインタラクティブなデータ可視化ガイド - matplotlib&seabornでのヒストグラム表示 2020.04.182025.08.22 [seaborn] 12. データの分布をヒストグラムとKDEプロットで表示(distplot, kdeplot) 2020.03.182025.09.16 [seaborn] 4. lineplotで信頼区間つき線グラフを表示する 2020.03.122025.09.17 [seaborn] 13. 2つのデータの関係性を2次元プロットで表示(jointplot) 2020.03.212025.09.16 [NumPy] 11. NumPy配列におけるNaNの様々な処理方法 2019.12.222025.09.17 [matplotlib] 125. マスク値とNaN値を含むデータのプロット 2025.08.152025.09.17 [matplotlib animation] 81.バウンドするボール 2020.06.072025.09.05 [ipywidgets] 24. Dropdownを活用したインタラクティブなデータ可視化ガイド - matplotlib&seabornでのヒストグラム表示 2020.04.182025.08.22 [NumPy] 7. ブロードキャスト 2018.12.112025.08.29 [matplotlib] 98. ヒストグラムのalphaを調整して視認性を高める 2021.03.282025.08.14 [SciPy] 1. Scipyのcurve_fitで最小2乗法近似、決定係数R2も求める 2018.10.032025.09.17 [SciPy] 22. ノイジーなデータをsignalのsavgol_filterで平滑化 2022.01.222025.09.03 [SciPy] 16. scipy.signal.detrendでデータのトレンド除去 2021.05.132025.08.20 [SciPy] 18. integrate. trapezoid, simpsonなどで離散的データの数値積分 2021.05.142025.09.17 [SciPy] 7. SciPyで画像処理: ndimage.morphology.distance_transform_edtを使った背景からの距離計算 2019.11.122025.09.17 [SciPy] 2. ガウス分布によるカーブフィッティング 2019.01.022025.09.17 [matplotlib] 74. ColorPickerで色を選択し、クリックしたマーカーを着色する。さらに、色ごとに集計した結果を棒グラフで表示する 2020.04.152025.09.05 [matplotlib] 39. データ値に基づく色分けプロット技法 2019.08.102025.09.17 [pandas] 8. DataFrameに欠損値(NaN)があるときの処理 2019.01.102025.08.22 [pandas] 9. 階層構造をもつインデックスについて 2019.01.112025.09.20 [pandas] 1.複数のエクセルファイルをひとつにまとめる 2018.10.062025.09.20 [pandas] 3. DataFrameにおけるインデックスについて 2019.01.072025.09.20 [matplotlib] 74. ColorPickerで色を選択し、クリックしたマーカーを着色する。さらに、色ごとに集計した結果を棒グラフで表示する 2020.04.152025.09.05 [ipywidgets] 19. Jupyter labでipywidgetsを動かす 2020.03.102020.03.22 [ipywidgets] 24. Dropdownを活用したインタラクティブなデータ可視化ガイド - matplotlib&seabornでのヒストグラム表示 2020.04.182025.08.22 [ipywidgets] 21. 画像上でクリックした点の座標と値をOutputで表示 2020.03.272025.08.22 [ipywidgets] 20. IntProgressでプログレスバーを表示する方法 2020.03.112025.09.17 [matplotlib] 69. 散布図上でクリックした点に関連付けられたデータを下図に表示する 2020.04.022025.09.05 錯視 [matplotlibで錯視] 7. エビングハウス錯視 2019.11.072025.09.17 [matplotlibで錯視] 9. 同じ色なのに違って見える?ムンカー錯視 2019.12.302025.08.15 [matplotlib] 136. ペンローズの三角形 2026.02.25 [matplotlibで錯視] 15. 放射状パターンが錯覚を引き起こす!matplotlibで作る驚きのヘリング錯視 2021.07.122025.08.14 [matplotlibで錯視] 12. 回転する四角形のサイズ変化錯視 2020.01.132025.09.17 [matplotlibで錯視] 3. きらめき格子錯視 2019.02.262025.09.17 サボテン ヤシの実チップ[ベラボン]の吸水性、保水性について 2018.11.022019.11.04 発泡スチロール箱によるサボテンの防寒対策 2018.12.252019.11.05 鶴仙園オリジナル培養土の保水性について 2018.12.312019.11.03 簡易温室によるサボテンの防寒対策(保温効果の検証) 2018.12.312019.11.05 [matplotlib] 74. ColorPickerで色を選択し、クリックしたマーカーを着色する。さらに、色ごとに集計した結果を棒グラフで表示する 2020.04.152025.09.05 サボテン・多肉植物用土各種の保水性について 2018.11.072019.11.05