 matplotlib
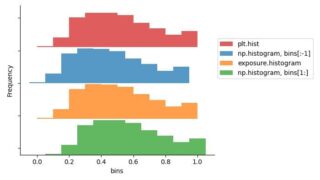
 [scikit-image] 107. skimageで画像のヒストグラムを作成する(exposure. histogram)
scikit-imageのexposure.histogram関数を使った画像ヒストグラム作成方法を解説。画像の明るさ分布を視覚化し、skimage、numpy、matplotlibのヒストグラム関数の比較も含む。画像処理や分析に役立つ基本テクニックを紹介。
matplotlib  matplotlib
  matplotlib
  matplotlib
  matplotlib
  python
  matplotlib
  matplotlib