はじめに
この記事では、matplotlibの凡例(legend)表示における凡例ボックス内の表示位置の調整方法について詳しく解説します。凡例の配置場所や表示スタイルをカスタマイズする方法を実例とともに紹介します。
コード&解説
モジュールのインポートなど
バージョン
データの生成
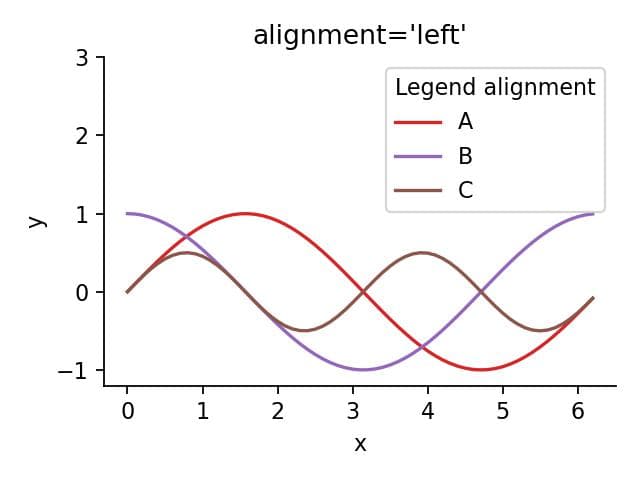
判例box内で左に寄せて表示
ax.legend()でax.legend(alignment=”left”)とすると以下のようになります。
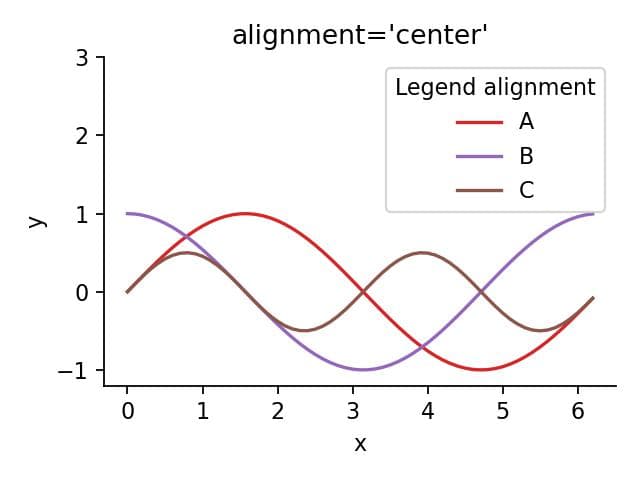
判例box内の中央に表示
ax.legend()でax.legend(alignment=”center”)とすると以下のようになります。
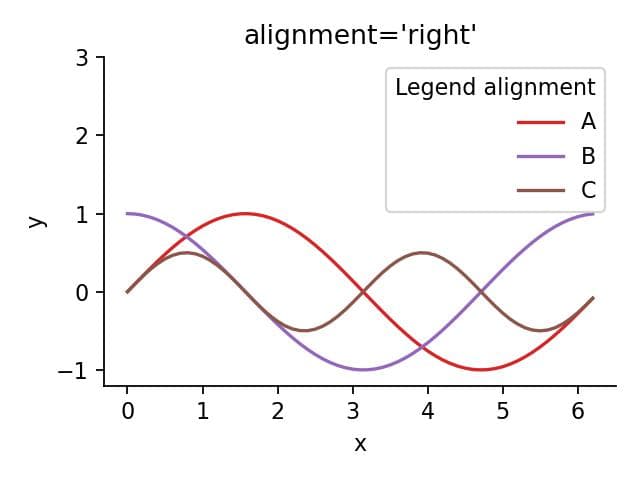
判例box内で右に寄せて表示
ax.legend()でax.legend(alignment=”right”)とすると以下のようになります。
参考

https://matplotlib.org/stable/users/prev_whats_new/whats_new_3.6.0.html
matplotlib.org

コメント