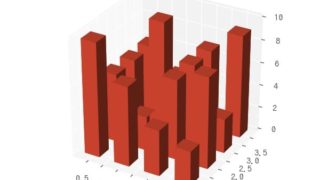
matplotlib 3D [matplotlib 3D] 6.2次元ヒストグラムの3D表示 matplotlibのmplot3dを使用して2次元ヒストグラムを3Dグラフとして可視化する方法を解説。データ分布の密度を立体的に表現し、視覚的な分析を容易にする技術について詳しく説明します。 2018.10.11 matplotlib 3Dpython
 matplotlib 3D