 matplotlib
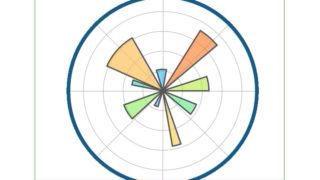
 [matplotlib animation] 95. 極座標棒グラフのアニメーション
matplotlibのFuncAnimationを使用して極座標棒グラフのアニメーションを作成する方法を解説。極座標系でのデータ可視化とアニメーション技術を組み合わせた実践的なPythonコーディング例を提供します。
matplotlib 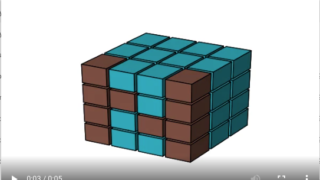 matplotlib 3D
 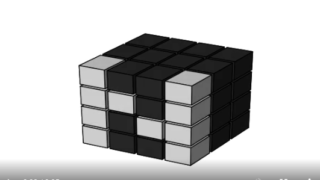 matplotlib 3D
  matplotlib 3D