 matplotlib 3D
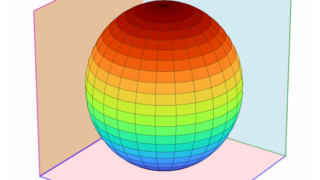
 [matplotlib 3D] 58. 3Dプロットの面と枠線の色をカスタマイズする方法
matplotlib mplot3dモジュールで作成する3Dグラフの面(pane)とその枠線の色をカスタマイズする方法を解説。グラフの視認性と美観を向上させるための設定方法やサンプルコードを紹介します。
 matplotlib 3D
  matplotlib