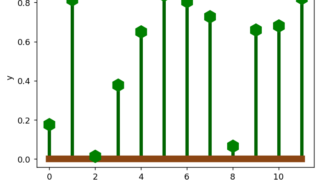
matplotlib [matplotlib] 31. 棒とマーカーの両方を表示したグラフ matplotlibのstem関数を使って棒とマーカーの両方を表示したグラフを作成する方法を解説。基本的な使い方からスタイル変更、複数データの表示、信号処理での応用例まで具体的なコード例と共に紹介しています。 2019.03.30 matplotlibpython
 matplotlib