 matplotlib
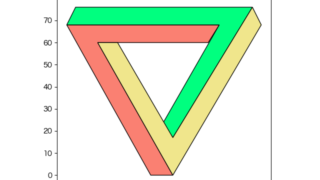
 [matplotlib] 136. ペンローズの三角形
Pythonのmatplotlibを使ってペンローズの三角形(不可能図形)を描画する方法を解説。3つの面をPolygonクラスで作成し、SVG形式で保存してInkscapeで編集する手順まで、実践的なコード例とともに紹介します。
matplotlib  matplotlib
  matplotlib
  matplotlib
  matplotlib
  matplotlib
  matplotlib
  lmfit
lmfit