はじめに
この記事では、matplotlibのaxes.Axes.fill_betweenxを使用して、曲線で囲まれたx方向の範囲を塗りつぶす方法について解説します。グラフの視覚的な表現を強化するための便利な機能です。
コード
解説
モジュールのインポート
バージョン
データの生成
np.random.normal(mu, sigma, 100000)関数を使用して、平均muと標準偏差sigmaのガウス分布に従うデータポイントを100,000個生成します。
np.histogram(d1, bins=20, range=(-1,2))関数で、d1データのヒストグラムを作成します。ビンの数は20、範囲は-1から2に設定しています。この関数はビンと頻度データを返します。
bins1=bins1[:-1]によって、ビンと頻度のサイズを一致させています。
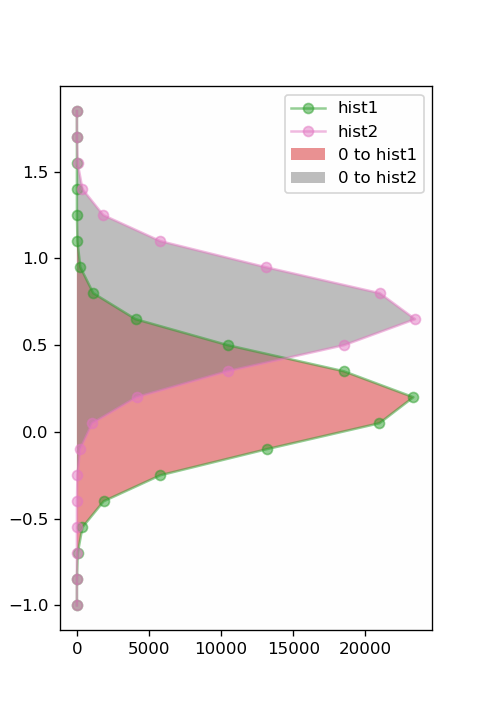
fill_betweenxによる塗りつぶし
ax.fill_betweenx(bins1, 0, hist1)を使用して、y座標がbins1の範囲で、x=0からx=hist1までの領域を塗りつぶします。
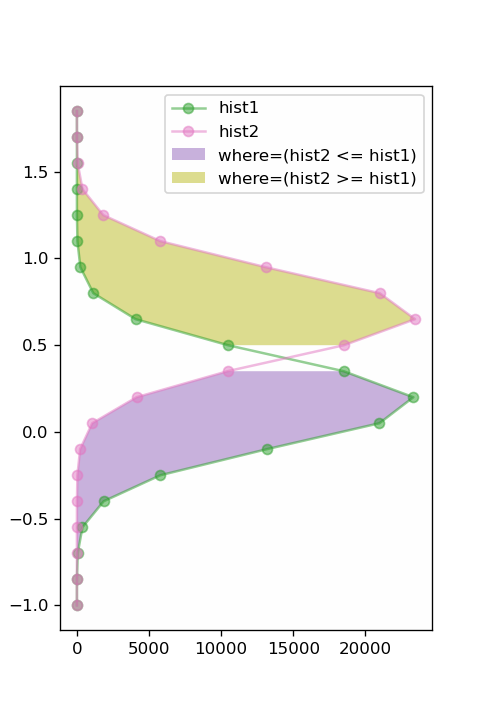
whereによる塗りつぶす範囲の指定
where=(hist2 <= hist1)パラメータを使うと、hist2がhist1以下となっている範囲のみを塗りつぶすことができる。
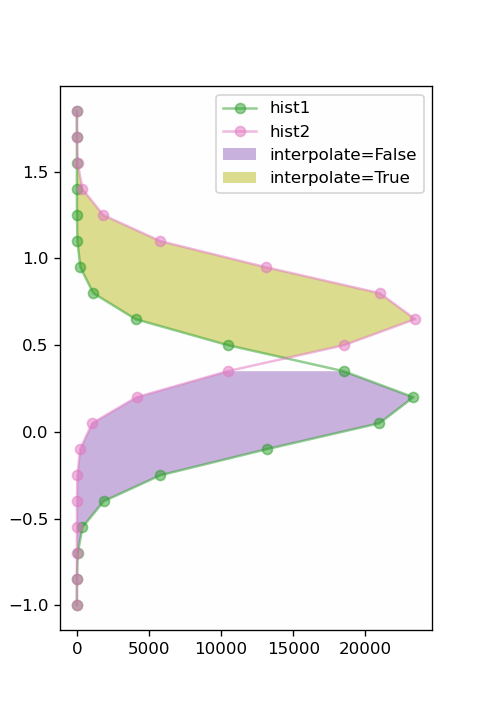
interpolate=Trueによる塗りつぶす範囲の補間
interpolate=Trueパラメータを設定すると、線が交差する箇所で発生する空白部分を自動的に塗りつぶすことができます。このパラメータはデフォルトではFalseに設定されています。
参考

matplotlib.axes.Axes.fill_betweenx — Matplotlib 3.3.1 documentation
matplotlib.org

numpy.random.normal — NumPy v2.4 Manual
numpy.org

numpy.histogram — NumPy v2.4 Manual
numpy.org
コメント