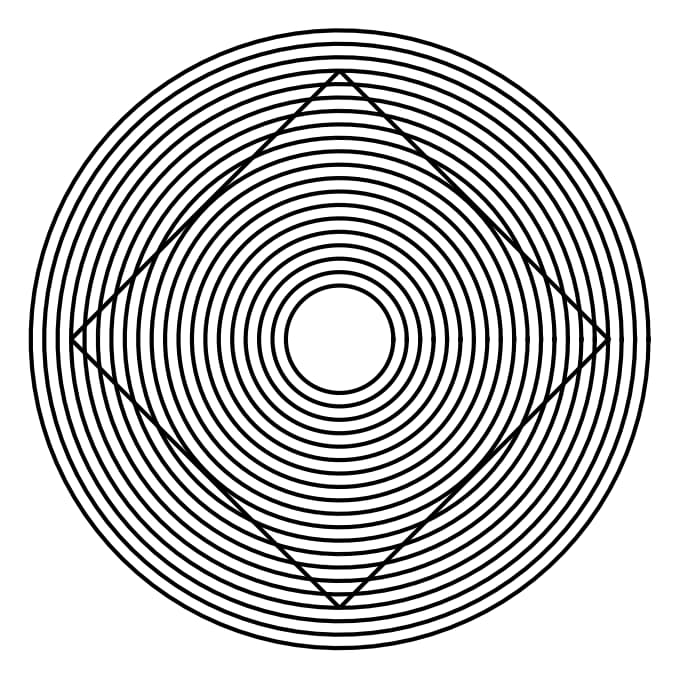
matplotlibでエーレンシュタイン錯視1を作成する
エーレンシュタイン錯視とは?
エーレンシュタイン錯視とは、同心円の内側にある正方形の辺が、歪んで見える錯視のことである。このエーレンシュタイン錯視をmatplotlibを用いて作成する。
コード
This file contains bidirectional Unicode text that may be interpreted or compiled differently than what appears below. To review, open the file in an editor that reveals hidden Unicode characters.
Learn more about bidirectional Unicode characters
%matplotlib inline | |
import matplotlib.pyplot as plt | |
import numpy as np | |
plt.rcParams['savefig.dpi']=150 | |
fig = plt.figure(figsize=(8,6)) | |
ax = fig.add_subplot(111) | |
#ax.yaxis.set_major_locator(plt.MultipleLocator(0.2)) | |
fig.patch.set_facecolor('white') # 図の背景 | |
ax.patch.set_facecolor('white') # axの背景 | |
plt.tick_params(labelbottom=False, labelleft=False) | |
plt.tick_params(color='white') | |
ax.spines['right'].set_visible(False) | |
ax.spines['left'].set_visible(False) | |
ax.spines['top'].set_visible(False) | |
ax.spines['bottom'].set_visible(False) | |
t = np.linspace(0, 2*np.pi, 100) | |
c, s = np.cos(t), np.sin(t) | |
a=1 | |
b=1 | |
p=1 | |
x = np.abs(c)**(2/p) * a * np.sign(c) | |
y = np.abs(s)**(2/p) * b * np.sign(s) | |
#四角 | |
ax.plot(x,y,'k-',lw=2) | |
#円 | |
[ax.plot(i*c,i*s,'k-', lw=2) for i in np.arange(0.2,1.2,0.05)] | |
ax.axis('scaled') | |
plt.savefig("Ehrenstein.png",bbox_inches = 'tight', pad_inches = 0) | |
plt.show() |
解説
モジュールのインポートと図の作成
This file contains bidirectional Unicode text that may be interpreted or compiled differently than what appears below. To review, open the file in an editor that reveals hidden Unicode characters.
Learn more about bidirectional Unicode characters
%matplotlib inline
import matplotlib.pyplot as plt
import numpy as np
plt.rcParams['savefig.dpi']=150
fig = plt.figure(figsize=(8,6))
ax = fig.add_subplot(111)
背景色の設定
This file contains bidirectional Unicode text that may be interpreted or compiled differently than what appears below. To review, open the file in an editor that reveals hidden Unicode characters.
Learn more about bidirectional Unicode characters
fig.patch.set_facecolor('white') # 図の背景
ax.patch.set_facecolor('white') # axの背景
fig.patch.set_facecolor(‘white’), ax.patch.set_facecolor(‘white’) で図を含めた画像全体の背景と図の背景を白にしている。
目盛と目盛ラベルを非表示
This file contains bidirectional Unicode text that may be interpreted or compiled differently than what appears below. To review, open the file in an editor that reveals hidden Unicode characters.
Learn more about bidirectional Unicode characters
plt.tick_params(labelbottom=False, labelleft=False)
plt.tick_params(color='white')
plt.tick_params(labelbottom=False, labelleft=False)で目盛ラベルを非表示にし、plt.tick_params(color=’white’)で目盛を白にして見えなくしている。
図の枠線の設定
This file contains bidirectional Unicode text that may be interpreted or compiled differently than what appears below. To review, open the file in an editor that reveals hidden Unicode characters.
Learn more about bidirectional Unicode characters
ax.spines['right'].set_visible(False)
ax.spines['left'].set_visible(False)
ax.spines['top'].set_visible(False)
ax.spines['bottom'].set_visible(False)
図の枠線は、ax.spines[‘left’].set_visible(False)のようにすることで上下左右の枠線を非表示にできる。
円と四角を表示するためのパラメータ
This file contains bidirectional Unicode text that may be interpreted or compiled differently than what appears below. To review, open the file in an editor that reveals hidden Unicode characters.
Learn more about bidirectional Unicode characters
t = np.linspace(0, 2*np.pi, 100)
c, s = np.cos(t), np.sin(t)
四角と円を表示するためのパラメータとして、tとc,sを用いた。tは0〜2πのlinspace配列で、c,sはそのtを用いたcosとsinである。
四角の表示
This file contains bidirectional Unicode text that may be interpreted or compiled differently than what appears below. To review, open the file in an editor that reveals hidden Unicode characters.
Learn more about bidirectional Unicode characters
a=1
b=1
p=1
x = np.abs(c)**(2/p) * a * np.sign(c)
y = np.abs(s)**(2/p) * b * np.sign(s)
#四角
ax.plot(x,y,'k-',lw=2)
四角はスーパー楕円の式を用いて生成した。詳細は、下記を参照。
[matplotlib animation] 17. スーパー楕円(Superellipse)
matplotlib FuncAnimationによるスーパー楕円のアニメーションについて説明する。
円の表示
This file contains bidirectional Unicode text that may be interpreted or compiled differently than what appears below. To review, open the file in an editor that reveals hidden Unicode characters.
Learn more about bidirectional Unicode characters
#円
[ax.plot(i*c,i*s,'k-', lw=2) for i in np.arange(0.2,1.2,0.05)]
[ax.plot(i*c,i*s,’k-‘, lw=2) for i in np.arange(0.2,1.2,0.05)]のように、リスト内包表記で、半径がnp.arange(0.2,1.2,0.05)となる円を順次、描写していく。’k-‘, lw=2としているので、linewidthが2の黒い実線の円が表示される。
アスペクト比の調整
This file contains bidirectional Unicode text that may be interpreted or compiled differently than what appears below. To review, open the file in an editor that reveals hidden Unicode characters.
Learn more about bidirectional Unicode characters
ax.axis('scaled')
デフォルトの設定では、円が歪んでしまうので、ax.axis(‘scaled’)とすることで、xとy軸の表示間隔を揃えて、真円が表示されるようにしている。
コードをダウンロード(.pyファイル) コードをダウンロード(.ipynbファイル)参考
エーレンシュタイン錯視 - Wikipedia
コメント