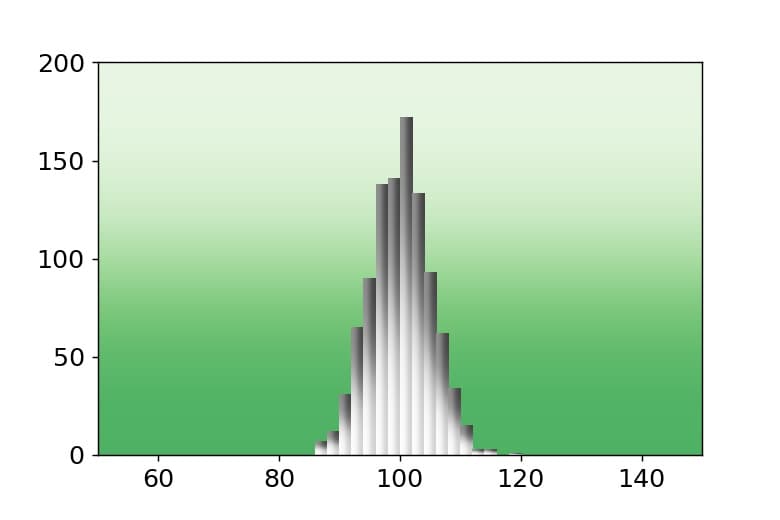
はじめに
matplotlibのplt.barで表示する棒グラフの棒の色をグラデーションカラーで表示する方法について説明する。
コード
This file contains bidirectional Unicode text that may be interpreted or compiled differently than what appears below. To review, open the file in an editor that reveals hidden Unicode characters.
Learn more about bidirectional Unicode characters
%matplotlib inline
import matplotlib.pyplot as plt
import numpy as np
from scipy.stats import norm
plt.rcParams['font.size']=14
plt.rcParams['font.family'] = 'sans-serif'
def gradient_image(ax, extent, direction=0.3, cmap_range=(0, 1), **kwargs):
"""
Draw a gradient image based on a colormap.
Parameters
----------
ax : Axes
The axes to draw on.
extent
The extent of the image as (xmin, xmax, ymin, ymax).
By default, this is in Axes coordinates but may be
changed using the *transform* kwarg.
direction : float
The direction of the gradient. This is a number in
range 0 (=vertical) to 1 (=horizontal).
cmap_range : float, float
The fraction (cmin, cmax) of the colormap that should be
used for the gradient, where the complete colormap is (0, 1).
**kwargs
Other parameters are passed on to `.Axes.imshow()`.
In particular useful is *cmap*.
"""
phi = direction * np.pi / 2
v = np.array([np.cos(phi), np.sin(phi)])
X = np.array([[v @ [1, 0], v @ [1, 1]],
[v @ [0, 0], v @ [0, 1]]])
a, b = cmap_range
X = a + (b - a) / X.max() * X
im = ax.imshow(X, extent=extent, interpolation='gaussian',
vmin=0, vmax=1, **kwargs)
return im
def gradient_bar(ax, x, y, width=0.5, bottom=0):
for left, top in zip(x, y):
right = left + width
gradient_image(ax, extent=(left, right, bottom, top),
cmap=plt.cm.Greys, cmap_range=(0., 0.8))
xmin, xmax = xlim = 50, 150
ymin, ymax = ylim = 0, 200
fig, ax = plt.subplots()
ax.set(xlim=xlim, ylim=ylim, autoscale_on=False)
# background image
gradient_image(ax, direction=0, extent=(0, 1, 0, 1), transform=ax.transAxes,
cmap=plt.cm.Greens, cmap_range=(0.6, 0.1))
sample_1 = norm.rvs(loc=100,scale=5,size=1000)
hist_1, bins = np.histogram(sample_1, 50, range=(50,150))
bins = bins[:-1]
x = bins
y = hist_1
gradient_bar(ax, x, y, width=2)
ax.set_aspect('auto')
plt.savefig('gradient_bar.jpg',dpi=130)
plt.show()

解説
モジュールのインポートなど
This file contains bidirectional Unicode text that may be interpreted or compiled differently than what appears below. To review, open the file in an editor that reveals hidden Unicode characters.
Learn more about bidirectional Unicode characters
%matplotlib inline
import matplotlib.pyplot as plt
import numpy as np
from scipy.stats import norm
plt.rcParams['font.size']=14
plt.rcParams['font.family'] = 'sans-serif'
グラデーションカラー生成関数
This file contains bidirectional Unicode text that may be interpreted or compiled differently than what appears below. To review, open the file in an editor that reveals hidden Unicode characters.
Learn more about bidirectional Unicode characters
def gradient_image(ax, extent, direction=0.3, cmap_range=(0, 1), **kwargs):
"""
Draw a gradient image based on a colormap.
Parameters
----------
ax : Axes
The axes to draw on.
extent
The extent of the image as (xmin, xmax, ymin, ymax).
By default, this is in Axes coordinates but may be
changed using the *transform* kwarg.
direction : float
The direction of the gradient. This is a number in
range 0 (=vertical) to 1 (=horizontal).
cmap_range : float, float
The fraction (cmin, cmax) of the colormap that should be
used for the gradient, where the complete colormap is (0, 1).
**kwargs
Other parameters are passed on to `.Axes.imshow()`.
In particular useful is *cmap*.
"""
phi = direction * np.pi / 2
v = np.array([np.cos(phi), np.sin(phi)])
X = np.array([[v @ [1, 0], v @ [1, 1]],
[v @ [0, 0], v @ [0, 1]]])
a, b = cmap_range
X = a + (b - a) / X.max() * X
im = ax.imshow(X, extent=extent, interpolation='gaussian',
vmin=0, vmax=1, **kwargs)
return im
axではグラデーションカラーを表示する図を指定する。
extentは図中の表示範囲の設定であり、デフォルトはデータ座標なので相対的な座標で設定するには、transform=ax.transAxesなどのようにする。
directionはグラデーションの方向であり、0で垂直方向、1で水平方向となる。
cmap_rangeではカラーマップの範囲を指定する。最低と最高はそれぞれ0と1となる。
phiで角度を指定して、単位ベクトルvでグラデーションの方向を定義する。Xで4隅の座標を得て、a,bの大きさに揃えたXを最終的に得る。これをinterpolation=’gaussian’でimshowすることでグラデーションカラーが得られる。
以下にdirectionを変化させたときの値の変化を示す。
#direction = 0.5
This file contains bidirectional Unicode text that may be interpreted or compiled differently than what appears below. To review, open the file in an editor that reveals hidden Unicode characters.
Learn more about bidirectional Unicode characters
#direction = 0.5
direction = 0.5
phi = direction * np.pi / 2
v = np.array([np.cos(phi), np.sin(phi)])
X = np.array([[v @ [1, 0], v @ [1, 1]],
[v @ [0, 0], v @ [0, 1]]])
a, b = cmap_range = 0.2,0.8
X_ = a + (b - a) / X.max() * X
print(phi)
print(v)
print(X)
print(X_)
'''
0.7853981633974483
[0.70710678 0.70710678]
[[0.70710678 1.41421356]
[0. 0.70710678]]
[[0.5 0.8]
[0.2 0.5]]
'''
#direction = 1
This file contains bidirectional Unicode text that may be interpreted or compiled differently than what appears below. To review, open the file in an editor that reveals hidden Unicode characters.
Learn more about bidirectional Unicode characters
#direction = 1
direction = 1
phi = direction * np.pi / 2
v = np.array([np.cos(phi), np.sin(phi)])
X = np.array([[v @ [1, 0], v @ [1, 1]],
[v @ [0, 0], v @ [0, 1]]])
a, b = cmap_range = 0.2,0.8
X_ = a + (b - a) / X.max() * X
print(phi)
print(v)
print(X)
print(X_)
'''
1.5707963267948966
[6.123234e-17 1.000000e+00]
[[6.123234e-17 1.000000e+00]
[0.000000e+00 1.000000e+00]]
[[0.2 0.8]
[0.2 0.8]]
'''
#direction = 0
This file contains bidirectional Unicode text that may be interpreted or compiled differently than what appears below. To review, open the file in an editor that reveals hidden Unicode characters.
Learn more about bidirectional Unicode characters
#direction = 0
direction = 0
phi = direction * np.pi / 2
v = np.array([np.cos(phi), np.sin(phi)])
X = np.array([[v @ [1, 0], v @ [1, 1]],
[v @ [0, 0], v @ [0, 1]]])
a, b = cmap_range = 0.2,0.8
X_ = a + (b - a) / X.max() * X
print(phi)
print(v)
print(X)
print(X_)
'''
0.0
[1. 0.]
[[1. 1.]
[0. 0.]]
[[0.8 0.8]
[0.2 0.2]]
'''
#direction = 0, a,b =.8,.2
This file contains bidirectional Unicode text that may be interpreted or compiled differently than what appears below. To review, open the file in an editor that reveals hidden Unicode characters.
Learn more about bidirectional Unicode characters
#direction = 0, a,b =.8,.2
direction = 0
phi = direction * np.pi / 2
v = np.array([np.cos(phi), np.sin(phi)])
X = np.array([[v @ [1, 0], v @ [1, 1]],
[v @ [0, 0], v @ [0, 1]]])
a, b = cmap_range = 0.8,0.2
X_ = a + (b - a) / X.max() * X
print(phi)
print(v)
print(X)
print(X_)
'''
0.0
[1. 0.]
[[1. 1.]
[0. 0.]]
[[0.2 0.2]
[0.8 0.8]]
'''
a, bを降順にすることでグラデーションを逆にすることができる。
グラデーション棒グラフ生成関数
This file contains bidirectional Unicode text that may be interpreted or compiled differently than what appears below. To review, open the file in an editor that reveals hidden Unicode characters.
Learn more about bidirectional Unicode characters
def gradient_bar(ax, x, y, width=0.5, bottom=0):
for left, top in zip(x, y):
right = left + width
gradient_image(ax, extent=(left, right, bottom, top),
cmap=plt.cm.Greys, cmap_range=(0., 0.8))
棒グラフの角棒のleft, right, bottom, topを取得して、gradient_image
を適用する。
軸範囲の設定
This file contains bidirectional Unicode text that may be interpreted or compiled differently than what appears below. To review, open the file in an editor that reveals hidden Unicode characters.
Learn more about bidirectional Unicode characters
xmin, xmax = xlim = 50, 150
ymin, ymax = ylim = 0, 200
図の生成
This file contains bidirectional Unicode text that may be interpreted or compiled differently than what appears below. To review, open the file in an editor that reveals hidden Unicode characters.
Learn more about bidirectional Unicode characters
fig, ax = plt.subplots()
ax.set(xlim=xlim, ylim=ylim, autoscale_on=False)
背景の設定
This file contains bidirectional Unicode text that may be interpreted or compiled differently than what appears below. To review, open the file in an editor that reveals hidden Unicode characters.
Learn more about bidirectional Unicode characters
# background image
gradient_image(ax, direction=0, extent=(0, 1, 0, 1), transform=ax.transAxes,
cmap=plt.cm.Greens, cmap_range=(0.6, 0.1))
extent=(0, 1, 0, 1), transform=ax.transAxesとすることで図全体にグラデーションカラーを表示できる。
データの生成
This file contains bidirectional Unicode text that may be interpreted or compiled differently than what appears below. To review, open the file in an editor that reveals hidden Unicode characters.
Learn more about bidirectional Unicode characters
sample_1 = norm.rvs(loc=100,scale=5,size=1000)
hist_1, bins = np.histogram(sample_1, 50, range=(50,150))
bins = bins[:-1]
x = bins
y = hist_1
norm.rvsで正規分布に従うランダムデータを生成する。
棒グラフの表示
This file contains bidirectional Unicode text that may be interpreted or compiled differently than what appears below. To review, open the file in an editor that reveals hidden Unicode characters.
Learn more about bidirectional Unicode characters
gradient_bar(ax, x, y, width=2)
ax.set_aspect('auto')
gradient_bar
でグラデーションカラー棒グラフを表示できる。
参考
Bar chart with gradients — Matplotlib 3.1.2 documentation
Interpolations for imshow — Matplotlib 3.10.1 documentation
matplotlib.pyplot.bar — Matplotlib 3.10.1 documentation
コメント
[…] [matplotlib] 58. 棒グラフのbarをグラデーションカラーで表示matplotlibのplt.barで表示する棒グラフの棒の色をグラデーションカラーで表示する方法について説明する。sabopy.com2020.01.29 […]