はじめに
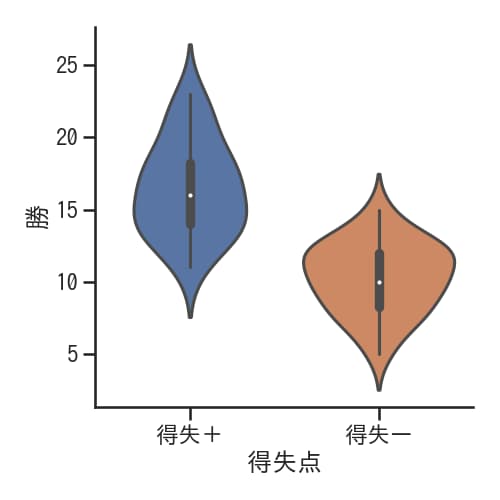
簡単かつ簡潔にデータを可視化できるseabornを使って、各カテゴリー内のデータの分布をバイオリンプロット(violinplot)で表示する方法について説明する。
コード
This file contains bidirectional Unicode text that may be interpreted or compiled differently than what appears below. To review, open the file in an editor that reveals hidden Unicode characters.
Learn more about bidirectional Unicode characters
import numpy as np
import pandas as pd
import matplotlib.pyplot as plt
import seaborn as sns
sns.set(style="ticks", color_codes=True)
sns.set_context('talk')
#read data
url1 = 'https://www.football-lab.jp/summary/team_ranking/j1/?year=2019'
df1 = pd.read_html(url1, match="勝点")[0]
url2 = 'https://www.football-lab.jp/summary/team_ranking/j1/?year=2018'
df2 = pd.read_html(url2, match="勝点")[0]
url3 = 'https://www.football-lab.jp/summary/team_ranking/j1/?year=2017'
df3 = pd.read_html(url3, match="勝点")[0]
df = pd.concat([df1,df2,df3])
df['得失点']=df['得失']>0
df.loc[df.得失点 ==True, '得失点'] = ['得失+']
df.loc[df.得失点 ==False, '得失点'] = ['得失ー']
df['ランク']=df['順位']<9
df.loc[df.ランク ==True, 'ランク'] = ['上位']
df.loc[df.ランク ==False, 'ランク'] = ['下位']
df.head().to_html('df_sns10.html')
df.head()
'''
順位 Unnamed: 1 Unnamed: 2 勝点 試合数 勝 分 敗 得点 失点 得失 平均得点 平均失点 得失点 ランク
0 1 NaN 横浜F・マリノス横浜FM 70 34 22 4 8 68 38 30 2.0 1.1 得失+ 上位
1 2 NaN FC東京FC東京 64 34 19 7 8 46 29 17 1.4 0.9 得失+ 上位
2 3 NaN 鹿島アントラーズ鹿島 63 34 18 9 7 54 30 24 1.6 0.9 得失+ 上位
3 4 NaN 川崎フロンターレ川崎F 60 34 16 12 6 57 34 23 1.7 1.0 得失+ 上位
4 5 NaN セレッソ大阪C大阪 59 34 18 5 11 39 25 14 1.1 0.7 得失+ 上位
'''
#catplot niolin
sns.catplot(x="得失点", y="勝", kind="violin",data=df)
plt.savefig("catplot_violin.png",dpi=100)

解説
モジュールのインポートなど
This file contains bidirectional Unicode text that may be interpreted or compiled differently than what appears below. To review, open the file in an editor that reveals hidden Unicode characters.
Learn more about bidirectional Unicode characters
import numpy as np
import pandas as pd
import matplotlib.pyplot as plt
import seaborn as sns
sns.set(style="ticks", color_codes=True)
sns.set_context('talk')
データの読み込み
This file contains bidirectional Unicode text that may be interpreted or compiled differently than what appears below. To review, open the file in an editor that reveals hidden Unicode characters.
Learn more about bidirectional Unicode characters
url1 = 'https://www.football-lab.jp/summary/team_ranking/j1/?year=2019'
df1 = pd.read_html(url1, match="勝点")[0]
url2 = 'https://www.football-lab.jp/summary/team_ranking/j1/?year=2018'
df2 = pd.read_html(url2, match="勝点")[0]
url3 = 'https://www.football-lab.jp/summary/team_ranking/j1/?year=2017'
df3 = pd.read_html(url3, match="勝点")[0]
df = pd.concat([df1,df2,df3])
データは下記サイトから2017〜2019シーズンのJ1の結果を取得し、pandasのDataFrameとした。
作成したDataFrameはpd.concatで結合した。

リーグサマリー:2019 J1 順位表 | データによってサッカーはもっと輝く | Football LAB
フットボールラボ(Football LAB)はサッカーをデータで分析し、新しいサッカーの観戦方法を伝えるサッカー情報サイトです。選手のプレーを評価するチャンスビルディングポイントやプレースタイル指標、チームの戦術を評価するチームスタイル指標...
新たな列データをDataFrameへ追加
This file contains bidirectional Unicode text that may be interpreted or compiled differently than what appears below. To review, open the file in an editor that reveals hidden Unicode characters.
Learn more about bidirectional Unicode characters
df['得失点']=df['得失']>0
df.loc[df.得失点 ==True, '得失点'] = ['得失+']
df.loc[df.得失点 ==False, '得失点'] = ['得失ー']
df['ランク']=df['順位']<9
df.loc[df.ランク ==True, 'ランク'] = ['上位']
df.loc[df.ランク ==False, 'ランク'] = ['下位']
得失のデータを使って得失点差がプラスなチームとマイナスなチームに分ける。プラスのチームには”得失+”をいれ、マイナスのチームには”得失ー”を入れる。
さらに、ランクについても同様に処理する。
DataFrameの最初の5行は以下のようになる。
順位 | Unnamed: 1 | Unnamed: 2 | 勝点 | 試合数 | 勝 | 分 | 敗 | 得点 | 失点 | 得失 | 平均得点 | 平均失点 | 得失点 | ランク | |
---|---|---|---|---|---|---|---|---|---|---|---|---|---|---|---|
0 | 1 | NaN | 横浜F・マリノス横浜FM | 70 | 34 | 22 | 4 | 8 | 68 | 38 | 30 | 2.0 | 1.1 | 得失+ | 上位 |
1 | 2 | NaN | FC東京FC東京 | 64 | 34 | 19 | 7 | 8 | 46 | 29 | 17 | 1.4 | 0.9 | 得失+ | 上位 |
2 | 3 | NaN | 鹿島アントラーズ鹿島 | 63 | 34 | 18 | 9 | 7 | 54 | 30 | 24 | 1.6 | 0.9 | 得失+ | 上位 |
3 | 4 | NaN | 川崎フロンターレ川崎F | 60 | 34 | 16 | 12 | 6 | 57 | 34 | 23 | 1.7 | 1.0 | 得失+ | 上位 |
4 | 5 | NaN | セレッソ大阪C大阪 | 59 | 34 | 18 | 5 | 11 | 39 | 25 | 14 | 1.1 | 0.7 | 得失+ | 上位 |
violinplotの表示
This file contains bidirectional Unicode text that may be interpreted or compiled differently than what appears below. To review, open the file in an editor that reveals hidden Unicode characters.
Learn more about bidirectional Unicode characters
sns.catplot(x="得失点", y="勝", kind="violin",data=df)
sns.catplot(x=”得失点”, y=”勝”, kind=”violin”,data=df)により、DataFrame(df)の得失点のカテゴリー別に勝データのviolinplotを表示する。

ヴァイオリン内部を変える
This file contains bidirectional Unicode text that may be interpreted or compiled differently than what appears below. To review, open the file in an editor that reveals hidden Unicode characters.
Learn more about bidirectional Unicode characters
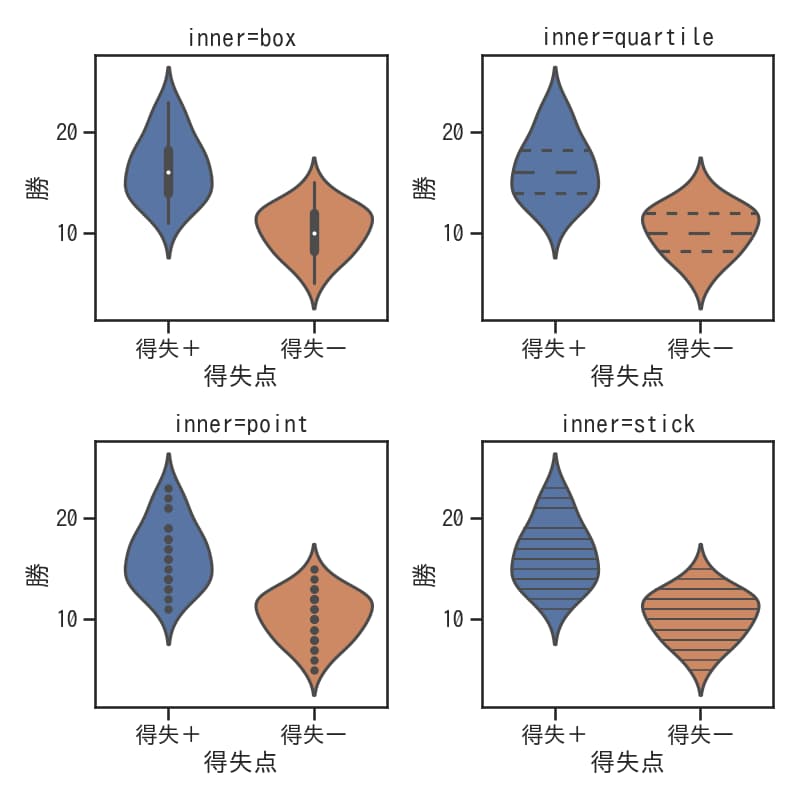
inner = ['box','quartile','point','stick']
fig,ax = plt.subplots(2,2,figsize=(8,8))
ax=ax.ravel()
sns.violinplot(x="得失点", y="勝", kind="violin",inner='box',data=df,ax=ax[0])
sns.violinplot(x="得失点", y="勝", kind="violin",inner='quartile',data=df,ax=ax[1])
sns.violinplot(x="得失点", y="勝", kind="violin",inner='point',data=df,ax=ax[2])
sns.violinplot(x="得失点", y="勝", kind="violin",inner='stick',data=df,ax=ax[3])
[ax[i].set_title('inner='+inner[i]+'') for i in range(4)]
plt.tight_layout()
plt.savefig("catplot_violin_inner.png",dpi=100)
innerの値を変えることでviolin内部の表示を変えることができる。以下の4種類がある。

hueを設定した場合
This file contains bidirectional Unicode text that may be interpreted or compiled differently than what appears below. To review, open the file in an editor that reveals hidden Unicode characters.
Learn more about bidirectional Unicode characters
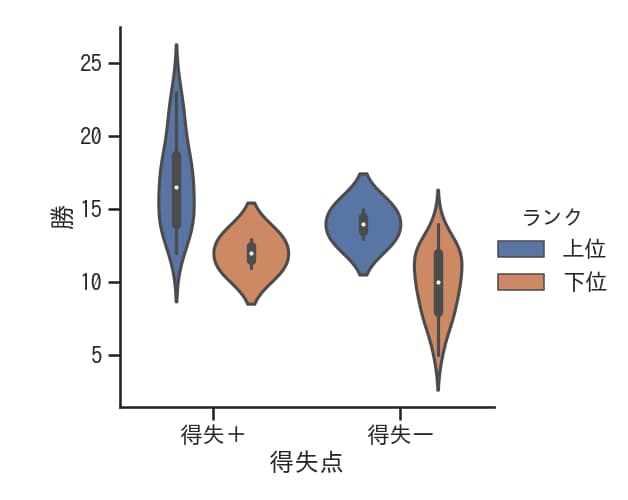
sns.catplot(x="得失点", y="勝", kind="violin",hue='ランク',data=df)
hue=’ランク’とすることでランクに応じて色分けされたviolinplotが表示される。

split=Trueでヴァイオリンの片側のみを表示
This file contains bidirectional Unicode text that may be interpreted or compiled differently than what appears below. To review, open the file in an editor that reveals hidden Unicode characters.
Learn more about bidirectional Unicode characters
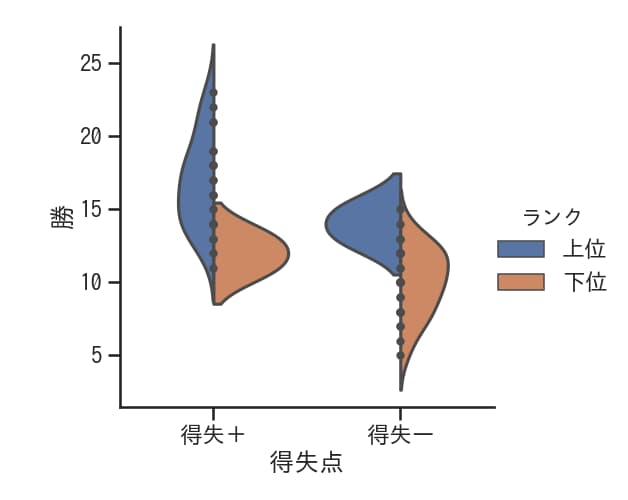
sns.catplot(x="得失点", y="勝", kind="violin", hue='ランク',inner="point", split=True,data=df)
hueを設定した状態でsplit=Trueとすると片側のみにヴァイオリンを表示できる。

violinplotとswarmplotを合わせて表示
This file contains bidirectional Unicode text that may be interpreted or compiled differently than what appears below. To review, open the file in an editor that reveals hidden Unicode characters.
Learn more about bidirectional Unicode characters
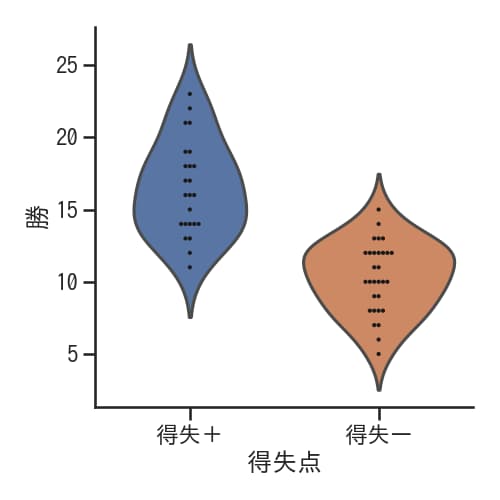
g = sns.catplot(x="得失点", y="勝", kind="violin", inner=None, data=df)
sns.swarmplot(x="得失点", y="勝", color="k", size=3, data=df, ax=g.ax);
violinplot とswarmplotを組み合わせて表示することをできる。

swarmplotについては下記で解説した。

[seaborn] 8. stripplotとswarmplotで各カテゴリーのデータを散布図で表示
簡単かつ簡潔にデータを可視化できるライブラリであるseabornのstripplotとswarmplotを用いて、各カテゴリーのデータをそれぞれ散布図で表示する方法について説明する。
参考
Visualizing categorical data — seaborn 0.13.2 documentation
seaborn.violinplot — seaborn 0.13.2 documentation
コメント