はじめに
3次元オブジェクトの細線化は、複雑な形状を単純化して骨格構造を抽出するための重要な画像処理技術です。scikit-imageライブラリのskimage.morphology.skeletonize関数を使用すると、この処理を効率的に実行できます。
コード
解説
モジュールのインポートなど
バージョン
構造化要素で物体を作成
skimage,morphologyのoctahedronとballを使って構造化要素を作成して、それらをnp.concatenateで連結して3次元オブジェクトを作成します。
3次元オブジェクトの細線化
skeletonizeで細線化する。2次元画像の細線化については下記記事で解説しました。
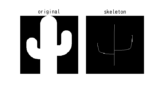
[scikit-image] 23. 画像の細線化処理(morphology.skeletonize)
scikit-imageのmorphology.skeletonize関数を使った画像の細線化処理について解説。物体の骨格抽出の基本から応用例まで、画像処理技術の効率化に役立つ情報を提供します。
sabopy.com
2019.06.13
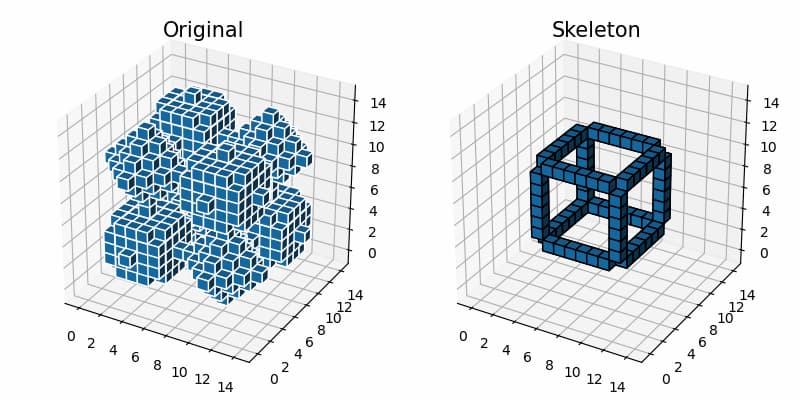
結果の表示
ボクセルグラフでオリジナル物体とその物体を細線化した結果を表示します。なお、ボクセルグラフについては下記で解説しました。
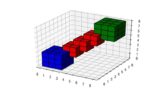
[matplotlib 3D] 28. Pythonで3D voxelグラフ
Pythonのmatplotlibを使用した3D voxelグラフの作成方法について解説します。voxelは3次元空間内のピクセルで、データの可視化や3D構造の表現に役立ちます。このチュートリアルでは基本的な使い方から応用例まで紹介します。
sabopy.com
2018.10.29
回転アニメーション
回転アニメーションは以下記事を参考にして作成しました。
[matplotlib 3D] 14. 3Dグラフの回転アニメーション
matplotlibのmplot3dを使用して3Dグラフの回転アニメーションを作成する方法を解説します。動画として保存する手順や回転角度の制御など、3Dビジュアライゼーションを動的に表現するための基本テクニックを紹介します。
sabopy.com
2018.10.25
まとめ
scikit-imageのskeletonize関数を使用することで、3次元オブジェクトの骨格構造を効率的に抽出できます。この技術は様々な分野での形状解析や特徴抽出に役立ちます。特に複雑な構造を持つオブジェクトを単純化し、その本質的な形状特性を理解するのに有効です。
実装時には、対象となるオブジェクトの特性やノイズの有無に応じて、前処理や後処理を追加することで、より精度の高い細線化結果を得ることができます。
参考

Generate footprints (structuring elements) — skimage 0.26.1rc0.dev0 documentation
scikit-image.org

skimage.morphology — skimage 0.26.1rc0.dev0 documentation
scikit-image.org
コメント