はじめに
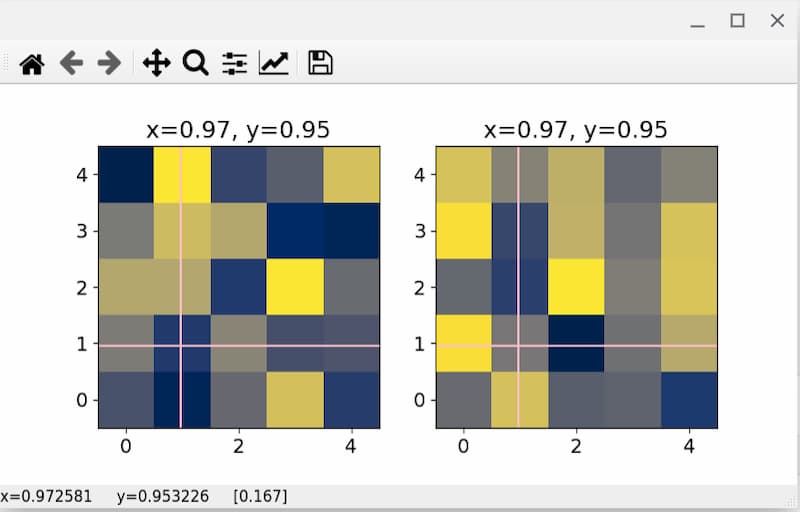
本記事では、matplotlibを使用して2つの画像を表示し、両方の画像に共通する十字カーソル(Cursor)を実装する方法について解説します。複数の画像間で位置を対応付けて観察したい場合に便利なテクニックです。
コード
解説
モジュールのインポートなど
matplotlibをjupyter labやnotebook内ではなく、Qt5Aggのバックエンドを使用して別ウィンドウで表示します。
バージョン
class DoubleCursorの作成
コンストラクタ
self.lx = ax.axhline(color=’g’)で水平な線を表示し、self.ly = ax.axvline(color=’g’)で垂直な線を表示させます。ax2についても同様の処理を行います。また、ax、ax2をそれぞれself.ax、self.ax2として参照します。
mouse_moveの設定
if not event.inaxes: returnでax領域内にカーソルがない場合は処理を終了します。 event.xdataとevent.ydataからカーソルの現在位置をそれぞれx、yとして取得します。
self.lx.set_ydata(y)で水平線の位置をy値に設定し、self.ly.set_xdata(x)で垂直線の位置をx値に設定します。ax2についても同様に水平線と垂直線を更新します。
self.ax.set_titleでx、y座標の値をタイトルに表示し、self.ax.figure.canvas.draw()で図を再描画します。
図の表示
fig.canvas.mpl_connectで’motion_notify_event’を登録し、カーソルを動かすたびにd_cursorクラスのmouse_moveメソッドが実行されるようにします。
まとめ
matplotlibを使用して複数の画像に共通するカーソルを表示することで、異なる画像間の同じ位置を簡単に比較できるようになります。この機能は画像処理や科学データの分析において非常に有用であり、視覚的な比較分析の効率を大幅に向上させることができます。
参考


コメント