はじめに
matplotlibライブラリを使用して、2次および3次のベジェ曲線をPythonで描画する方法について解説する記事です。ベジェ曲線の基本的な理論から実装方法まで、ステップバイステップで説明しています。
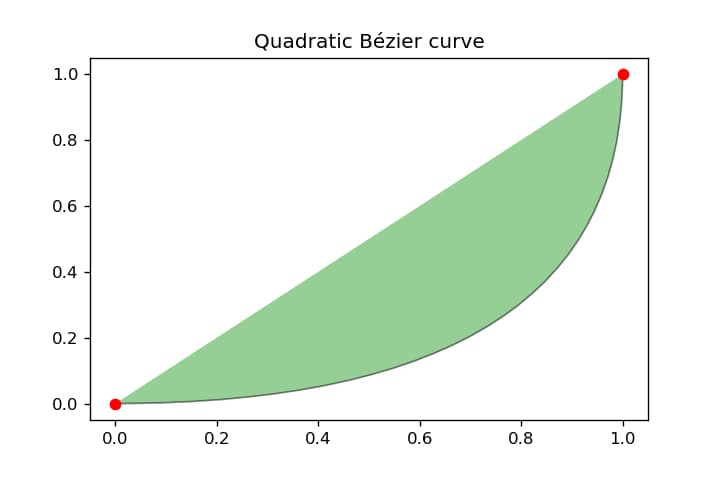
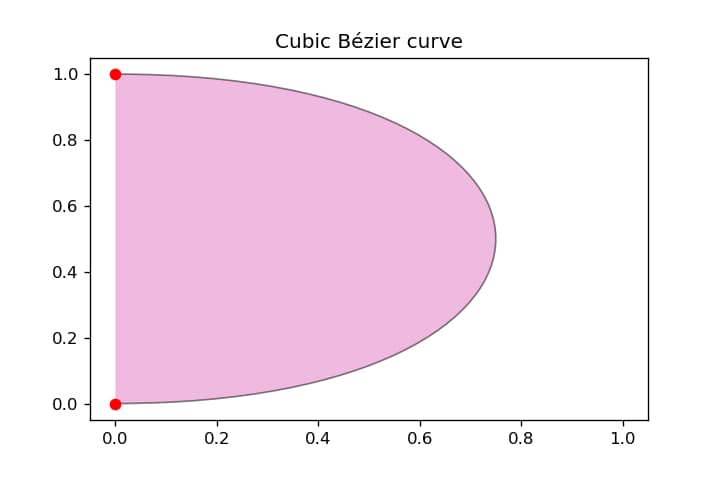
ベジェ曲線とは、複数の制御点によって定義される滑らかな曲線で、コンピュータグラフィックスやデザインで広く使用されています。特定の数学的公式に基づいて、始点と終点を結ぶ滑らかな経路を生成します。2次ベジェ曲線は3つの制御点を、3次ベジェ曲線は4つの制御点を使用します。
コード
解説
モジュールのインポートなど
バージョン
2次のベジェ曲線
2次のベジェ曲線はPath.CURVE3を使います。
3次のベジェ曲線
3次のベジェ曲線はPath.CURVE4を使います。
まとめ
本記事では、matplotlibを使用したベジェ曲線の描画方法について解説しました。2次曲線と3次曲線の両方の実装方法を学び、Pythonでの曲線描画の基本を理解することができました。これらの技術は、データ可視化やグラフィックデザインなど、様々な分野で応用可能です。
参考

Bezier Curve — Matplotlib 3.1.0 documentation
matplotlib.org
コメント