はじめに
seabornは簡単かつ簡潔にデータを可視化できるライブラリである。ここではseabornにより散布図を表示する方法について説明する。
コード
This file contains bidirectional Unicode text that may be interpreted or compiled differently than what appears below. To review, open the file in an editor that reveals hidden Unicode characters.
Learn more about bidirectional Unicode characters
import numpy as np
import pandas as pd
import matplotlib.pyplot as plt
import seaborn as sns
sns.set(style="darkgrid")
sns.set_context('talk')
url1 = 'https://www.football-lab.jp/summary/team_ranking/j1/?year=2019'
df_j1 = pd.read_html(url1, match="勝点")[0]
df_j1.to_html('df1.html')
df_j1
'''
順位 Unnamed: 1 Unnamed: 2 勝点 試合数 勝 分 敗 得点 失点 得失 平均得点 平均失点
0 1 NaN 横浜F・マリノス横浜FM 70 34 22 4 8 68 38 30 2.0 1.1
1 2 NaN FC東京FC東京 64 34 19 7 8 46 29 17 1.4 0.9
2 3 NaN 鹿島アントラーズ鹿島 63 34 18 9 7 54 30 24 1.6 0.9
3 4 NaN 川崎フロンターレ川崎F 60 34 16 12 6 57 34 23 1.7 1.0
4 5 NaN セレッソ大阪C大阪 59 34 18 5 11 39 25 14 1.1 0.7
5 6 NaN サンフレッチェ広島広島 55 34 15 10 9 45 29 16 1.3 0.9
6 7 NaN ガンバ大阪G大阪 47 34 12 11 11 54 48 6 1.6 1.4
7 8 NaN ヴィッセル神戸神戸 47 34 14 5 15 61 59 2 1.8 1.7
8 9 NaN 大分トリニータ大分 47 34 12 11 11 35 35 0 1.0 1.0
9 10 NaN 北海道コンサドーレ札幌札幌 46 34 13 7 14 54 49 5 1.6 1.4
10 11 NaN ベガルタ仙台仙台 41 34 12 5 17 38 45 -7 1.1 1.3
11 12 NaN 清水エスパルス清水 39 34 11 6 17 45 69 -24 1.3 2.0
12 13 NaN 名古屋グランパス名古屋 37 34 9 10 15 45 50 -5 1.3 1.5
13 14 NaN 浦和レッズ浦和 37 34 9 10 15 34 50 -16 1.0 1.5
14 15 NaN サガン鳥栖鳥栖 36 34 10 6 18 32 53 -21 0.9 1.6
15 16 NaN 湘南ベルマーレ湘南 36 34 10 6 18 40 63 -23 1.2 1.9
16 17 NaN 松本山雅FC松本 31 34 6 13 15 21 40 -19 0.6 1.2
17 18 NaN ジュビロ磐田磐田 31 34 8 7 19 29 51 -22 0.9 1.5
'''
sns.relplot(x="勝", y="得点", data=df_j1);
plt.savefig("scatter.png",dpi=100)
解説
モジュールのインポートなど
This file contains bidirectional Unicode text that may be interpreted or compiled differently than what appears below. To review, open the file in an editor that reveals hidden Unicode characters.
Learn more about bidirectional Unicode characters
import numpy as np
import pandas as pd
import matplotlib.pyplot as plt
import seaborn as sns
sns.set(style="darkgrid")
sns.set_context('talk')
seabornはsnsとしてインポートするのが一般的となっている。
sns.set(style=”darkgrid”)で見た目の設定を変えて、sns.set_context(‘talk’)で文字サイズなどを変えている。
データの読み込み
This file contains bidirectional Unicode text that may be interpreted or compiled differently than what appears below. To review, open the file in an editor that reveals hidden Unicode characters.
Learn more about bidirectional Unicode characters
url1 = 'https://www.football-lab.jp/summary/team_ranking/j1/?year=2019'
df_j1 = pd.read_html(url1, match="勝点")[0]
df_j1.to_html('df1.html')
df_j1
データは下記サイトから2019シーズンのJ1の結果を取得した。
リーグサマリー:2019 J1 順位表 | データによってサッカーはもっと輝く | Football LAB
フットボールラボ(Football LAB)はサッカーをデータで分析し、新しいサッカーの観戦方法を伝えるサッカー情報サイトです。選手のプレーを評価するチャンスビルディングポイントやプレースタイル指標、チームの戦術を評価するチームスタイル指標...
順位 | Unnamed: 1 | Unnamed: 2 | 勝点 | 試合数 | 勝 | 分 | 敗 | 得点 | 失点 | 得失 | 平均得点 | 平均失点 | |
---|---|---|---|---|---|---|---|---|---|---|---|---|---|
0 | 1 | NaN | 横浜F・マリノス横浜FM | 70 | 34 | 22 | 4 | 8 | 68 | 38 | 30 | 2.0 | 1.1 |
1 | 2 | NaN | FC東京FC東京 | 64 | 34 | 19 | 7 | 8 | 46 | 29 | 17 | 1.4 | 0.9 |
2 | 3 | NaN | 鹿島アントラーズ鹿島 | 63 | 34 | 18 | 9 | 7 | 54 | 30 | 24 | 1.6 | 0.9 |
3 | 4 | NaN | 川崎フロンターレ川崎F | 60 | 34 | 16 | 12 | 6 | 57 | 34 | 23 | 1.7 | 1.0 |
4 | 5 | NaN | セレッソ大阪C大阪 | 59 | 34 | 18 | 5 | 11 | 39 | 25 | 14 | 1.1 | 0.7 |
5 | 6 | NaN | サンフレッチェ広島広島 | 55 | 34 | 15 | 10 | 9 | 45 | 29 | 16 | 1.3 | 0.9 |
6 | 7 | NaN | ガンバ大阪G大阪 | 47 | 34 | 12 | 11 | 11 | 54 | 48 | 6 | 1.6 | 1.4 |
7 | 8 | NaN | ヴィッセル神戸神戸 | 47 | 34 | 14 | 5 | 15 | 61 | 59 | 2 | 1.8 | 1.7 |
8 | 9 | NaN | 大分トリニータ大分 | 47 | 34 | 12 | 11 | 11 | 35 | 35 | 0 | 1.0 | 1.0 |
9 | 10 | NaN | 北海道コンサドーレ札幌札幌 | 46 | 34 | 13 | 7 | 14 | 54 | 49 | 5 | 1.6 | 1.4 |
10 | 11 | NaN | ベガルタ仙台仙台 | 41 | 34 | 12 | 5 | 17 | 38 | 45 | -7 | 1.1 | 1.3 |
11 | 12 | NaN | 清水エスパルス清水 | 39 | 34 | 11 | 6 | 17 | 45 | 69 | -24 | 1.3 | 2.0 |
12 | 13 | NaN | 名古屋グランパス名古屋 | 37 | 34 | 9 | 10 | 15 | 45 | 50 | -5 | 1.3 | 1.5 |
13 | 14 | NaN | 浦和レッズ浦和 | 37 | 34 | 9 | 10 | 15 | 34 | 50 | -16 | 1.0 | 1.5 |
14 | 15 | NaN | サガン鳥栖鳥栖 | 36 | 34 | 10 | 6 | 18 | 32 | 53 | -21 | 0.9 | 1.6 |
15 | 16 | NaN | 湘南ベルマーレ湘南 | 36 | 34 | 10 | 6 | 18 | 40 | 63 | -23 | 1.2 | 1.9 |
16 | 17 | NaN | 松本山雅FC松本 | 31 | 34 | 6 | 13 | 15 | 21 | 40 | -19 | 0.6 | 1.2 |
17 | 18 | NaN | ジュビロ磐田磐田 | 31 | 34 | 8 | 7 | 19 | 29 | 51 | -22 | 0.9 | 1.5 |
散布図の表示
This file contains bidirectional Unicode text that may be interpreted or compiled differently than what appears below. To review, open the file in an editor that reveals hidden Unicode characters.
Learn more about bidirectional Unicode characters
sns.relplot(x="勝", y="得点", data=df_j1);
plt.savefig("scatter.png",dpi=100)
sns.relplotでx=”勝”, y=”得点”, data=df_j1とすることで,DataFrame(df_j1)の勝をx軸、得点をy軸とした散布図が得られる。以下のグラフが出力される。
図を保存するには、matplotlibと同様にplt.savefig()をすれば良い。
新たなパラメータを加えて色を変えて表示
This file contains bidirectional Unicode text that may be interpreted or compiled differently than what appears below. To review, open the file in an editor that reveals hidden Unicode characters.
Learn more about bidirectional Unicode characters
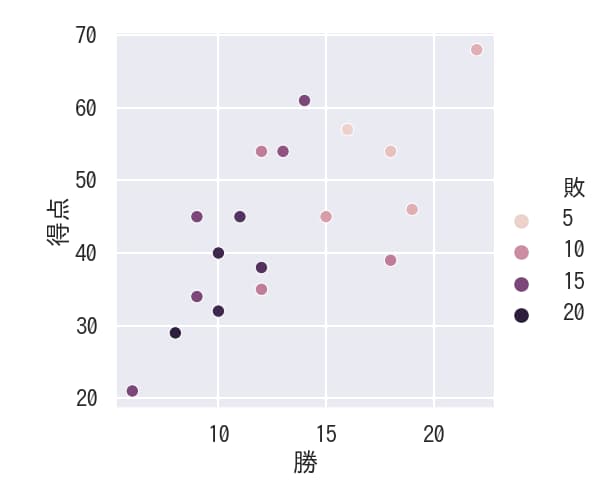
sns.relplot(x="勝", y="得点", data=df_j1,hue="敗")
hue=”敗”とすることで各点の負けた回数を色を変えて示すことができる。凡例が右に表示される。
新たなパラメータを加えて点の大きさを変えて表示
This file contains bidirectional Unicode text that may be interpreted or compiled differently than what appears below. To review, open the file in an editor that reveals hidden Unicode characters.
Learn more about bidirectional Unicode characters
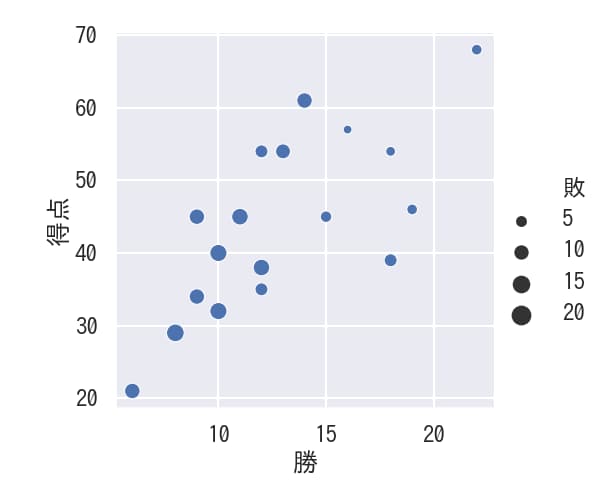
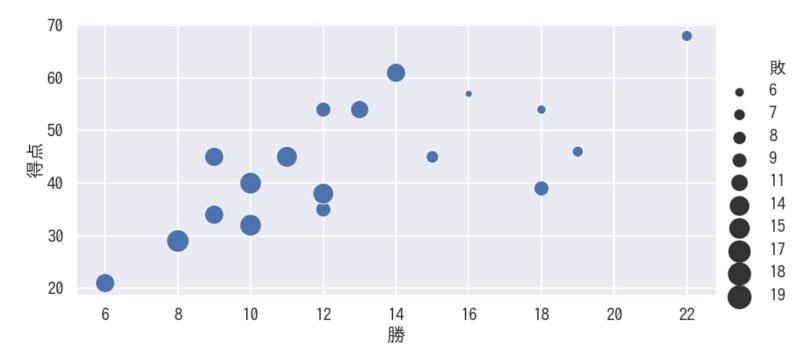
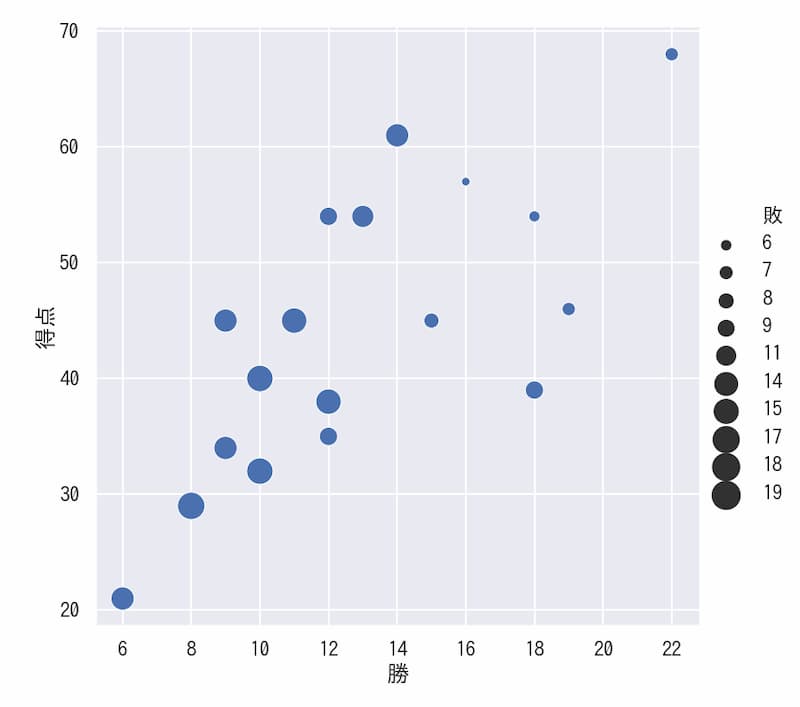
sns.relplot(x="勝", y="得点", data=df_j1,size="敗")
size=”敗”とすることで各点の負けた回数を色ではなく、点の大きさで違いを示すことができる。
点の大きさを変化させたい場合
This file contains bidirectional Unicode text that may be interpreted or compiled differently than what appears below. To review, open the file in an editor that reveals hidden Unicode characters.
Learn more about bidirectional Unicode characters
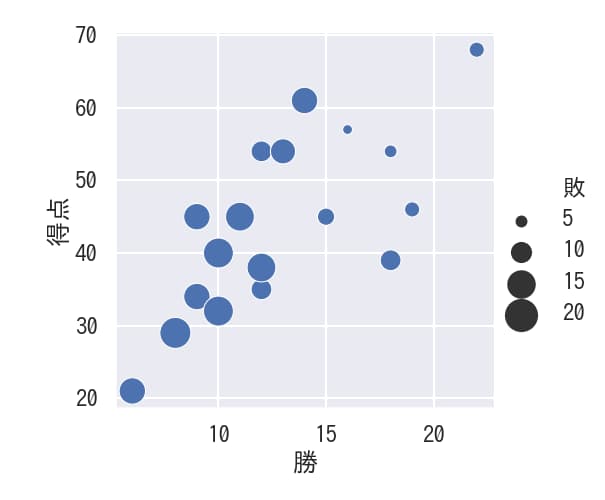
sns.relplot(x="勝", y="得点", data=df_j1,size="敗",sizes=(50, 500))
size=”敗”でsizes=(50, 500)とすることで、点の面積の最小値と最大値を設定することができる。
凡例をすべて表示
This file contains bidirectional Unicode text that may be interpreted or compiled differently than what appears below. To review, open the file in an editor that reveals hidden Unicode characters.
Learn more about bidirectional Unicode characters
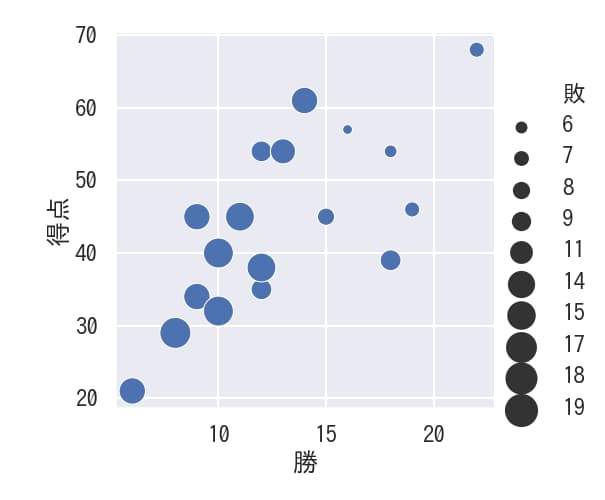
sns.relplot(x="勝", y="得点", data=df_j1,size="敗",sizes=(50, 500),legend="full")
legend=”full”で凡例をすべて表示することができる。
アスペクト比を変えて表示
This file contains bidirectional Unicode text that may be interpreted or compiled differently than what appears below. To review, open the file in an editor that reveals hidden Unicode characters.
Learn more about bidirectional Unicode characters
sns.relplot(x="勝", y="得点", data=df_j1,size="敗",sizes=(50, 500),legend="full",aspect=2)
aspect=2とすることで縦横比が2となる。
図の大きさを変えて表示
This file contains bidirectional Unicode text that may be interpreted or compiled differently than what appears below. To review, open the file in an editor that reveals hidden Unicode characters.
Learn more about bidirectional Unicode characters
sns.relplot(x="勝", y="得点", data=df_j1,size="敗",sizes=(50, 500),legend="full",height=8)#inch
heightを設定することで図の大きさが変えられる。インチ単位となっている。
コードをダウンロード(.pyファイル) コードをダウンロード(.ipynbファイル)参考
Visualizing statistical relationships — seaborn 0.13.2 documentation
コメント