 matplotlib
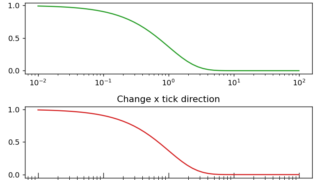
 [matplotlib] 117. 目盛りの細かい調整(ax.tick_params)
Matplotlibのtick_paramsメソッドを活用して目盛りの細かな調整を行う方法を解説。サイズ、色、角度、方向などのカスタマイズにより、学術論文やプレゼンテーションに最適化された見やすいグラフを作成するテクニックを紹介します。
matplotlib  matplotlib
  matplotlib
 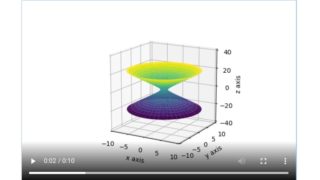 matplotlib Animation