はじめに
このノートでは、matplotlibライブラリを使用して、グラフの軸先端を矢印形状にする方法を解説します。mpl_toolkits.axisartistモジュールを活用した実装方法について、サンプルコードと具体例を交えながら説明していきます。数学や物理学の図表作成に役立つテクニックです。
コード
解説
モジュールのインポート
figの作成
グラフを作成するには、SubplotZero(fig, 111)のように、SubplotZeroを使用する必要があります。SubplotZeroはmatplotlib.axes._subplots.AxesZeroSubplotのクラスです。
軸の設定
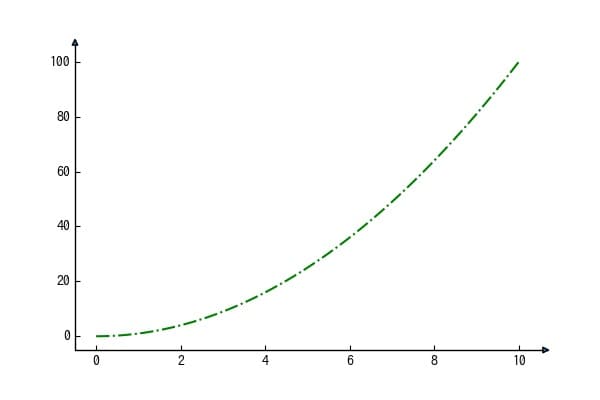
上と右の軸をset_visible(False)で非表示にします。下と左の軸に.set_axisline_style(“-|>”)を適用して軸の先端を矢印にします。
矢印のスタイルを変える
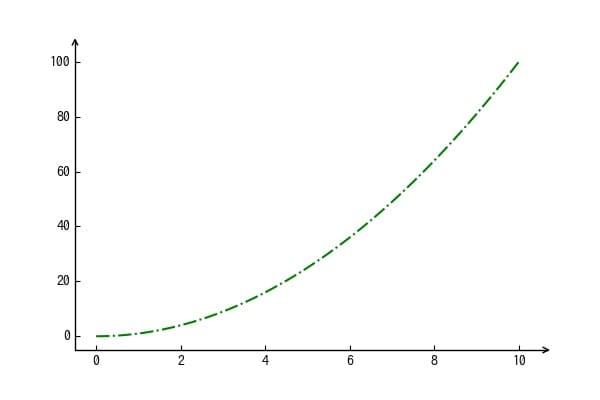
set_axisline_style(“->”)とすることで塗りつぶし矢印ではなく、普通の矢印となります。
先端の大きさを変える
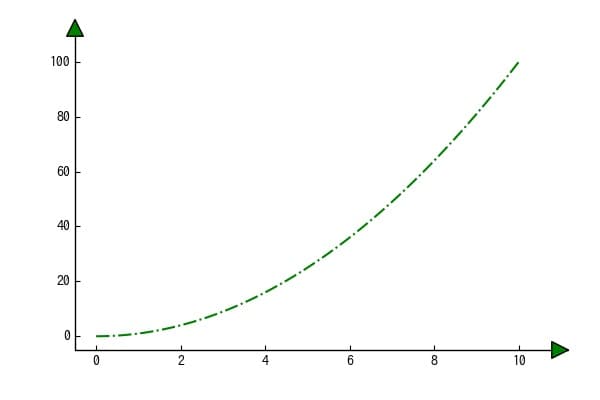
set_axisline_style(“-|>”, size=3)で矢印のサイズを変更できます。また、line.set_facecolor(“g”)で塗りつぶし矢印の色を変えられます。
軸、目盛り、目盛りラベルの色を変える
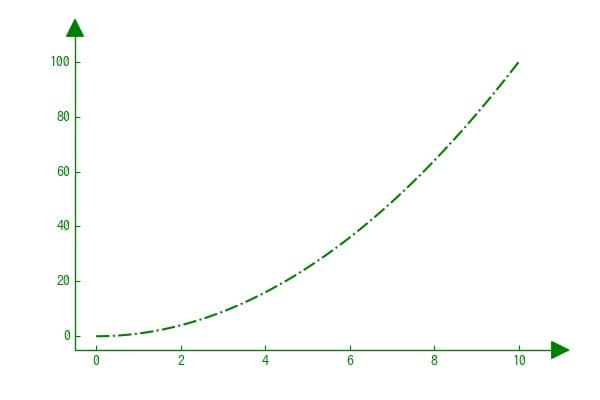
上記のようにすることで矢印、軸、目盛り、目盛りラベルの色を変えることができます。
コードをダウンロード(.pyファイル) コードをダウンロード(.ipynbファイル)参考

Axis line styles — Matplotlib 3.11.0 documentation
matplotlib.org

What is SubplotZero? (documentation lacking)
My questionI would like to know what matplotlib's SubplotZero() function does, knowing that it is not referenced in matp...
stackoverflow.com
How to increase the arrow size of axis_artist in matplotlib
I play around with the example from here. I want to increase the size of the arrows at the ends of x-axis and y-axis. I ...
stackoverflow.com

コメント