 jupyter notebook, lab
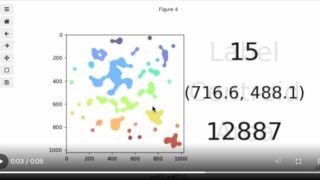
 [matplotlib] 112. クリックイベントでラベル画像のregionprops情報を表示
matplotlibとscikit-imageを組み合わせ、ラベル画像上でクリックイベントを検出し、クリックされた領域のregionprops情報(面積、周囲長、中心座標など)を動的に表示する実装方法を解説しています。画像解析や対話的な画像処理アプリケーション開発に役立つテクニックです。
jupyter notebook, lab  matplotlib