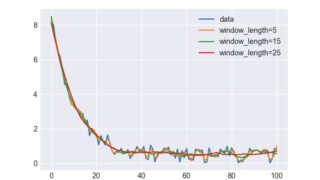
matplotlib [SciPy] 22. ノイジーなデータをsignalのsavgol_filterで平滑化 scipyのsavgol_filterを使って、ノイズの多いデータを滑らかにする方法について説明する。 2022.01.22 matplotlibpythonSciPy
ipywidgets [ipywidgets] 10. IntSliderでデータの移動平均をインタラクティブにプロット jupyter notebookの対話的にパラメータを調整できる機能(ipywidgets IntSlider)で、データの移動平均を対話的にプロットする方法について説明する。 2020.02.12 ipywidgetsmatplotlibpython
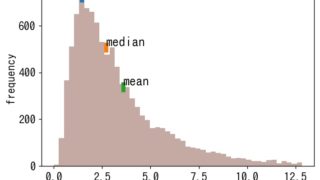
matplotlib [matplotlib] 52. 対数正規分布データのヒストグラムに最頻値、中央値、平均値を表示 numpyのrandom.lognormal()で対数正規分布に従うランダムな要素を生成し、matplotlibのplt.histでヒストグラムを作成する。そして、ヒストグラムに最頻値、中央値、平均値を表示する方法について説明する。 2019.12.13 matplotlibpython