 matplotlib 3D
 [NumPy] 20.配列のスライスをボクセルグラフで可視化
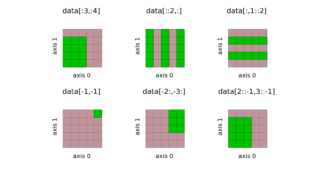
NumPy配列のスライシング操作を3次元ボクセルグラフで視覚的に解説。基本的なインデックス指定から高度なスライス表記まで、配列操作の理解を深めるための可視化例を紹介します。
matplotlib 3D 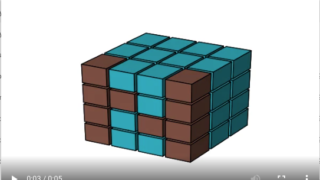 matplotlib 3D
  matplotlib 3D
 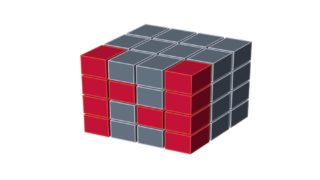 NumPy
NumPy  python
  matplotlib
  matplotlib