 matplotlib Animation
 [matplotlib animation] 30. 穴が塞がる円グラフ
matplotlib の FuncAnimation を使用して中心の穴が徐々に塞がっていく円グラフのアニメーションを作成する方法を解説。Python でのデータ視覚化における動的表現のテクニックを紹介しています。
matplotlib Animation 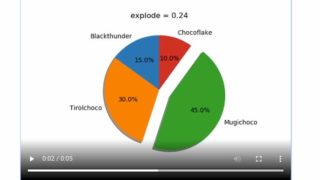 matplotlib Animation
 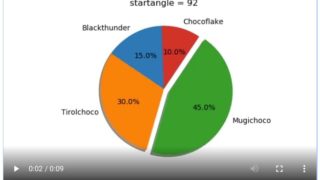 matplotlib Animation
 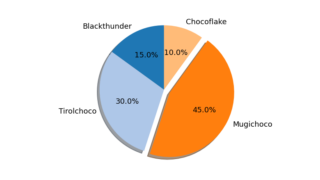 matplotlib