 python
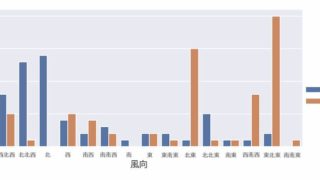
 [seaborn] 11. 棒グラフと折れ線グラフでカテゴリー内のデータの分布を表示(barplot, countplot, pointplot)
Seabornを使用して、カテゴリーデータの分布を視覚化する方法を解説。barplot、countplot、pointplotの使い方と活用例を紹介し、データ分析における効果的な可視化テクニックを学べます。
python 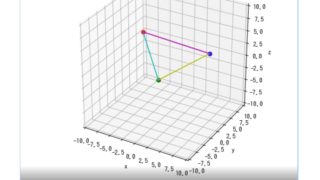 matplotlib Animation