 matplotlib
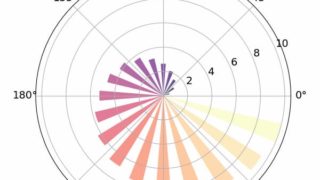
 [matplotlib] 86. 極座標棒グラフを描画する方法
Pythonのmatplotlibライブラリを使って極座標系での棒グラフを作成する方法を解説。角度と半径で表現する極座標グラフの基本から実装例までを具体的なコードとともに紹介します。
matplotlib  matplotlib
  matplotlib 3D