 matplotlib
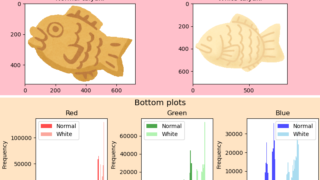
 [matplotlib] 101. subfiguresを使った効果的なグラフ配置の方法
matplotlibのsubfigures機能を使って複数のグラフを任意の位置に配置する方法を解説します。異なるサイズや配置のグラフを1つの図に効率的に組み合わせる技術について学びましょう。
matplotlib 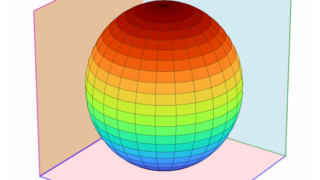 matplotlib 3D
  jupyter notebook, lab