 matplotlib
 [matplotlib] 110. 曲線下の積分区間を塗りつぶして表示する方法
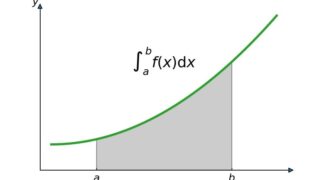
matplotlibを使用して曲線下の積分区間を色付きで塗りつぶして表示する方法を解説します。グラフ上で特定の範囲を視覚的に表現したい場合や、数学的な概念を図示する際に便利なテクニックをサンプルコード付きで紹介します。
matplotlib  matplotlib