Loading [MathJax]/extensions/tex2jax.js

[matplotlib animation] 111. 3D plotでfocal lengthを変えた時の見た目の変化

matplotlib

はじめに

Matplotlib 3.6.0から追加された新機能[3d plotのfocal length]を変化させた時に3d plotの見た目がどのように変わるかを、matplotlibのFuncAnimationのアニメーションで表示する。

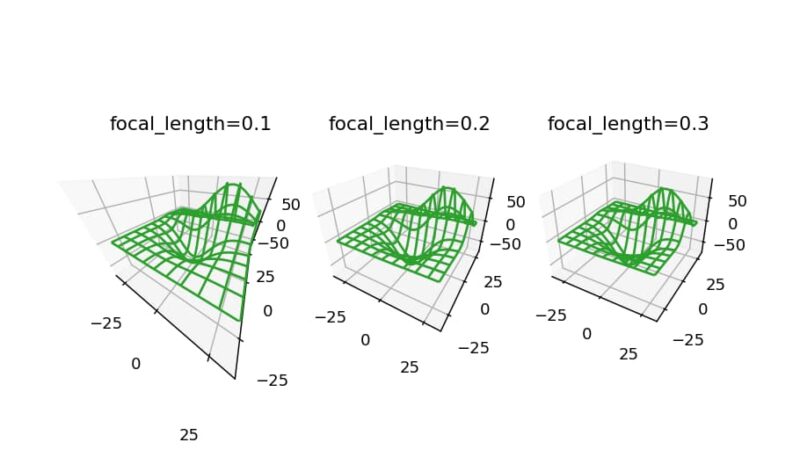
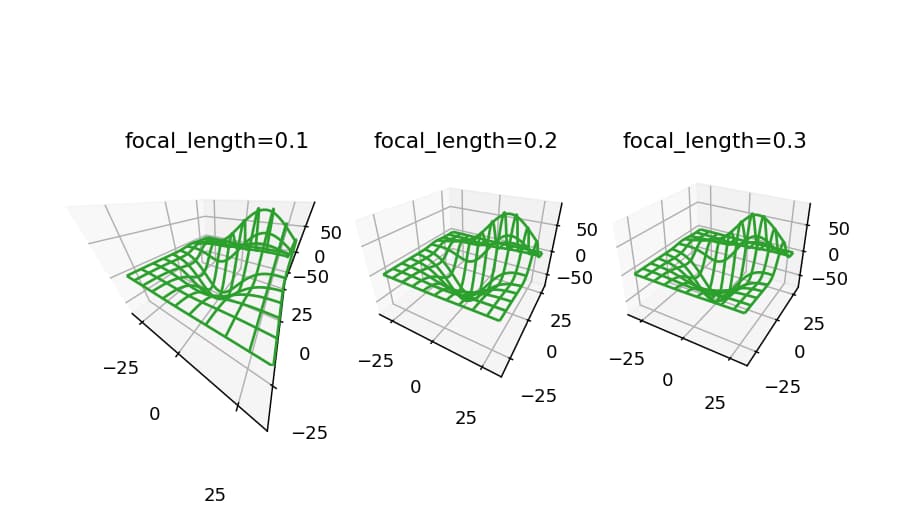
focal lengthは焦点距離のことで、デフォルト値は1である。1より焦点距離を長くすると3D plotの平坦化が進み、1から0の間で焦点距離を変化させると遠近感が強調されて、3D plotに奥行きが出るようになる。

コード&解説

モジュールのインポートなど

%matplotlib widget
import numpy as np
from mpl_toolkits.mplot3d import axes3d
from matplotlib import pyplot as plt
import matplotlib.animation as animation
from IPython.display import HTML

3D plot表示のために、mpl_toolkits.mplot3d からaxes3dをimportする。

バージョン

#version
import matplotlib
print(matplotlib.__version__)
print(np.__version__)
3.6.2
1.24.0

データの準備

X, Y, Z = axes3d.get_test_data(0.1)

axes3d.get_test_dataでテストデータ(X,Y,Z)を読み込む。

focal_lengthを変化させてプロット

fig, axs = plt.subplots(1, 3, figsize=(7, 4),
subplot_kw={'projection': '3d'})
for ax, focal_length in zip(axs, [0.1, 0.2, 0.3]):
ax.plot_wireframe(X, Y, Z, rcount=10, ccount=10,color="C2")
ax.set_proj_type('persp', focal_length=focal_length)
ax.set_title(f"{focal_length=}")
plt.savefig("focal_length.png",dpi=130)
plt.show()

ax.plot_wireframe()で3D plotを作成し、ax.set_proj_type(‘persp’)でfocal_lengthに適用な値を入れて表示すると以下のようになる。

アニメーションで表示

focal_lengthを連続的に変化させた時のアニメーションは以下のようになる。

focal_lengthの値は、np.logspace(-2,0,100)で10-2から100をlogスケールで等間隔に100点とした。

#anim
fig, ax = plt.subplots(subplot_kw={'projection': '3d'})
ax.plot_wireframe(X, Y, Z, rcount=10, ccount=10,color="C2")
focal_length=np.logspace(-2,0,100)
def update(i):
ax.set_proj_type('persp', focal_length=focal_length[i])
ax.set_title("focal_length="+str(np.round(focal_length[i],5))+"")
ani = animation.FuncAnimation(fig, update, 100,interval=50)
ani.save('focal_length_3D_anim.mp4', writer="ffmpeg",dpi=100)
HTML(ani.to_html5_video())
コードをダウンロード(.pyファイル)

コードをダウンロード(.ipynbファイル)

参考

What's new in Matplotlib 3.6.0 (Sep 15, 2022) — Matplotlib 3.6.2 documentation

コメント