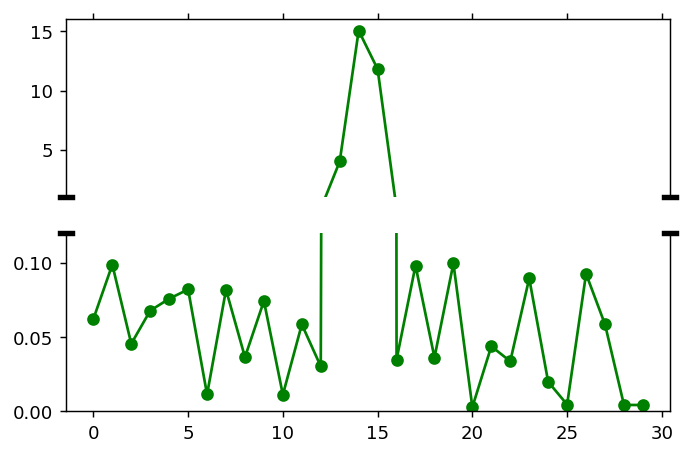
はじめに
matplotlibを使った軸の一部が省略されたグラフの作成についての解説する。
コード
This file contains bidirectional Unicode text that may be interpreted or compiled differently than what appears below. To review, open the file in an editor that reveals hidden Unicode characters.
Learn more about bidirectional Unicode characters
%matplotlib notebook
import matplotlib.pyplot as plt
import numpy as np
pts = np.random.rand(30)*.1
pts[13:16] *=200
fig, (ax, ax2) = plt.subplots(2, 1, sharex=True)
ax.plot(pts,'go-')
ax2.plot(pts,'go-')
ax.set_ylim(1,np.max(pts)+1)
ax2.set_ylim(0, .12)
ax.spines['bottom'].set_visible(False)
ax2.spines['top'].set_visible(False)
ax.xaxis.tick_top()
ax.tick_params(labeltop=False)
ax2.xaxis.tick_bottom()
d = 0.01
kwargs = dict(transform=ax.transAxes, color='k', lw=3, clip_on=False)
ax.plot((-d, +d), (0, 0), **kwargs)
ax.plot((1 - d, 1 + d), (0, 0), **kwargs)
kwargs.update(transform=ax2.transAxes)
ax2.plot((-d, +d), (1, 1), **kwargs)
ax2.plot((1 - d, 1 + d), (1, 1), **kwargs)
fig.savefig("broken_axis_scatter.png", dpi=100,transparent = False, bbox_inches = 'tight')
plt.show()

解説
モジュールのインポート
This file contains bidirectional Unicode text that may be interpreted or compiled differently than what appears below. To review, open the file in an editor that reveals hidden Unicode characters.
Learn more about bidirectional Unicode characters
%matplotlib notebook
import matplotlib.pyplot as plt
import numpy as np
バージョン
This file contains bidirectional Unicode text that may be interpreted or compiled differently than what appears below. To review, open the file in an editor that reveals hidden Unicode characters.
Learn more about bidirectional Unicode characters
#version
import matplotlib
print(matplotlib.__version__)
3.3.4
print(np.__version__)
1.20.1
データの生成
This file contains bidirectional Unicode text that may be interpreted or compiled differently than what appears below. To review, open the file in an editor that reveals hidden Unicode characters.
Learn more about bidirectional Unicode characters
pts = np.random.rand(30)*.1
pts[13:16] *=200
numpy.random.rand(30)
で0以上1未満の乱数を30個つくり、0.1をかけることで0〜0.1の数としている。
pts[13:16] *=200で13〜15番目の要素に200をかけて大きくしている。
グラフの設定とプロット
This file contains bidirectional Unicode text that may be interpreted or compiled differently than what appears below. To review, open the file in an editor that reveals hidden Unicode characters.
Learn more about bidirectional Unicode characters
fig, (ax, ax2) = plt.subplots(2, 1, sharex=True)
ax.plot(pts,'go-')
ax2.plot(pts,'go-')
fig, (ax, ax2) = plt.subplots(2, 1, sharex=True)でfigを作成して縦にaxとax2を並べることになる。sharex=Trueでaxとax2のx軸の設定を共有させている。
つまり、数値が大きいデータを上のグラフ(ax)に表示して、その他の数値が小さいデータを下のグラフ(ax2)に表示する。
ax.plot(pts,’go-‘), ax2.plot(pts,’go-‘)で上下のグラフにptsを緑の丸と線でプロットする。
y軸範囲の設定
This file contains bidirectional Unicode text that may be interpreted or compiled differently than what appears below. To review, open the file in an editor that reveals hidden Unicode characters.
Learn more about bidirectional Unicode characters
ax.set_ylim(1,np.max(pts)+1)
ax2.set_ylim(0, .12)
上のaxのグラフは、ax.set_ylim(1,np.max(pts)+1) とし、1〜ptsの最大値に+1した範囲で表示する。
下のax2のグラフは、ax2.set_ylim(0, .12) なので、0〜0.12の範囲で表示する。
グラフの枠と目盛りの設定
This file contains bidirectional Unicode text that may be interpreted or compiled differently than what appears below. To review, open the file in an editor that reveals hidden Unicode characters.
Learn more about bidirectional Unicode characters
ax.spines['bottom'].set_visible(False)
ax2.spines['top'].set_visible(False)
ax.xaxis.tick_top()
ax.tick_params(labeltop=False)
ax2.xaxis.tick_bottom()
顔は楕円型(Ellipse)で作成する。
グラフ枠は上下左右がそれぞれ、ax.Spinesの[Top],[Bottom],[Left],[Right]で設定できる。
ここでは、上のグラフ(ax)の下の枠線と、下のグラフ(ax2)の上の枠線を、.set_visible(False)で非表示としている。
ax.xaxis.tick_top()で上のグラフの上の枠線に目盛りを表示している。
ax.tick_params(labeltop=False) で目盛りのラベルが表示されないようにしている。
ax2.xaxis.tick_bottom() で下のグラフ(ax2)の下枠線に目盛りを表示している。
軸省略線の設定
This file contains bidirectional Unicode text that may be interpreted or compiled differently than what appears below. To review, open the file in an editor that reveals hidden Unicode characters.
Learn more about bidirectional Unicode characters
d = 0.01
kwargs = dict(transform=ax.transAxes, color='k', lw=3, clip_on=False)
ax.plot((-d, +d), (0, 0), **kwargs)
ax.plot((1 - d, 1 + d), (0, 0), **kwargs)
transform=ax.transAxesで、座標範囲を左下が (0, 0)、右上が (1, 1)の相対的な位置で指定できるようにしている。
color=’k’, lw=3で黒いlinewidth(線幅)が3の線。
clip_on=Falseでグラフの枠線からはみ出ても表示できるようにしている。
ax.plot((-d, +d), (0, 0), **kwargs) で上のグラフ(ax)の左下の省略線、ax.plot((1 - d, 1 + d), (0, 0), **kwargs)
で右下の省略線となる。
This file contains bidirectional Unicode text that may be interpreted or compiled differently than what appears below. To review, open the file in an editor that reveals hidden Unicode characters.
Learn more about bidirectional Unicode characters
kwargs.update(transform=ax2.transAxes)
ax2.plot((-d, +d), (1, 1), **kwargs)
ax2.plot((1 - d, 1 + d), (1, 1), **kwargs)
同様に下のグラフ(ax2)についても省略線を左上と右上に表示する。
グラフの保存
This file contains bidirectional Unicode text that may be interpreted or compiled differently than what appears below. To review, open the file in an editor that reveals hidden Unicode characters.
Learn more about bidirectional Unicode characters
fig.savefig("broken_axis_scatter.png", dpi=100,transparent = False, bbox_inches = 'tight')
“broken_axis_scatter.png” はファイル名で、dpi=100は解像度の設定となる。
transparent = False 背景を透過させないようにして、bbox_inches = ‘tight’でラベルなどが見切れないようにする。
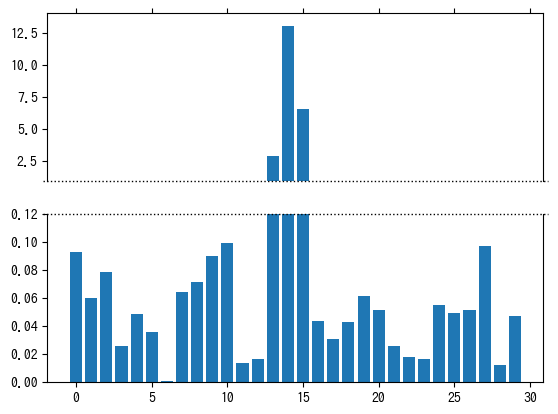
棒グラフの場合

省略線の設定
This file contains bidirectional Unicode text that may be interpreted or compiled differently than what appears below. To review, open the file in an editor that reveals hidden Unicode characters.
Learn more about bidirectional Unicode characters
d = 0.01
kwargs = dict(transform=ax.transAxes, color='k',linestyle=':', lw=1, clip_on=False)
ax.plot((-d, 1+d), (0, 0), **kwargs)
kwargs.update(transform=ax2.transAxes)
ax2.plot((-d, 1+d), (1, 1), **kwargs)
棒グラフでは、省略線を図全体に表示する設定としている。
コードをダウンロード(.pyファイル) コードをダウンロード(.ipynbファイル)参考

コメント