Loading [MathJax]/extensions/tex2jax.js

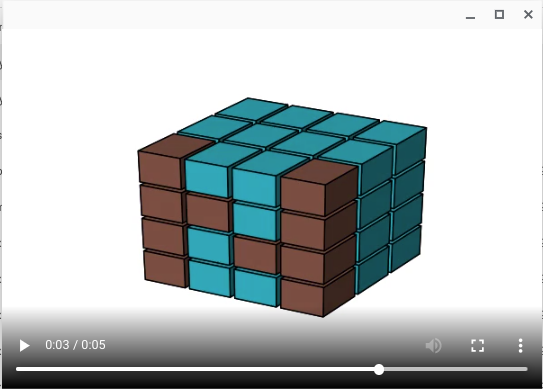
[matplotlib animation] 47. Voxelで作成したNumPyロゴの色変化アニメーション(カラー)

matplotlib 3D

はじめに

Voxelグラフで作成したNumPyロゴの色を変化させたアニメーションをmatplotlib FuncAnimationで表示する。

コード

import matplotlib.pyplot as plt
import numpy as np
from mpl_toolkits.mplot3d import Axes3D
import matplotlib.animation as animation
from IPython.display import HTML
fig = plt.figure()
ax = fig.gca(projection='3d')
def explode(data):
size = np.array(data.shape)*2
data_e = np.zeros(size - 1, dtype=data.dtype)
data_e[::2, ::2, ::2] = data
return data_e
# build up the numpy logo
n_voxels = np.zeros((4, 3, 4), dtype=bool)
n_voxels[0, 0, :] = True
n_voxels[-1, 0, :] = True
n_voxels[1, 0, 2] = True
n_voxels[2, 0, 1] = True
facecolors = np.where(n_voxels, 'k', 'k')
edgecolors = np.where(n_voxels, 'k', 'k')
filled = np.ones(n_voxels.shape)
# upscale the above voxel image, leaving gaps
filled_2 = explode(filled)
fcolors_2 = explode(facecolors)
ecolors_2 = explode(edgecolors)
# Shrink the gaps
x, y, z = np.indices(np.array(filled_2.shape) + 1).astype(float) // 2
x[0::2, :, :] += 0.05
y[:, 0::2, :] += 0.05
z[:, :, 0::2] += 0.05
x[1::2, :, :] += 0.95
y[:, 1::2, :] += 0.95
z[:, :, 1::2] += 0.95
def update(_):
ax.cla()
cycle = plt.rcParams['axes.prop_cycle'].by_key()['color']
col1= str(np.random.choice(cycle))
col2= str(np.random.choice(cycle))
facecolors = np.where(n_voxels,col1,col2)
fcolors_2 = explode(facecolors)
ax.axis('off')
ax.voxels(x, y, z, filled_2, facecolors=fcolors_2, edgecolors=ecolors_2)
ani = animation.FuncAnimation(fig, update, 25, interval=200)
HTML(ani.to_html5_video())
#ani.save('numpylogo_cc_color.mp4', writer="ffmpeg",dpi=100)

解説

モジュールのインポート

import matplotlib.pyplot as plt
import numpy as np
from mpl_toolkits.mplot3d import Axes3D
import matplotlib.animation as animation
from IPython.display import HTML

3Dグラフの作成

fig = plt.figure()
ax = fig.gca(projection='3d')

3Dグラフとするために、ax を fig.gca(projection=’3d’)とする。

Numpyロゴの設定

データの生成

# build up the numpy logo
n_voxels = np.zeros((4, 3, 4), dtype=bool)
n_voxels[0, 0, :] = True
n_voxels[-1, 0, :] = True
n_voxels[1, 0, 2] = True
n_voxels[2, 0, 1] = True

n_voxels = np.zeros((4, 3, 4), dtype=bool)では、bool値は0ならFalse、0以外ならTrueとなる。つまり、n_voxelsは4×3×4のFalseの配列となる。

n_voxels[0, 0, :] = Trueでn_voxelsの[0, 0, :]の部分がTrueになる。一連のTrue化により、Nの部分をTrueとしている。

facecolor, edgecolorの初期設定

facecolors = np.where(n_voxels, 'k', 'k')
edgecolors = np.where(n_voxels, 'k', 'k')

n_voxelsのTrueの部分を’k'(黒)として、Falseの部分を’k'(黒)とする。facecolorはアニメーションで変化させるので最初は両方とも黒にしている。edgecolorはすべてのボクセルで黒とした。

データの拡張

filled = np.ones(n_voxels.shape)
# upscale the above voxel image, leaving gaps
filled_2 = explode(filled)
fcolors_2 = explode(facecolors)
ecolors_2 = explode(edgecolors)

fillledはn_voxelsと同じかたちの要素がすべて1の配列。
filled_2はfilledをに下のexplode()関数を適用したものとなる。

def explode(data):
size = np.array(data.shape)*2
data_e = np.zeros(size - 1, dtype=data.dtype)
data_e[::2, ::2, ::2] = data
return data_e

dataの要素の2倍の大きさを要素として持つsizeという配列を作り、sizeの各配列の大きさを1小さくした0の配列(data_e)をつくって、data_eに2こ飛ばしでdataの要素を入れていくことになる。

ボクセル間の隙間の設定

# Shrink the gaps
x, y, z = np.indices(np.array(filled_2.shape) + 1).astype(float) // 2
x[0::2, :, :] += 0.05
y[:, 0::2, :] += 0.05
z[:, :, 0::2] += 0.05
x[1::2, :, :] += 0.95
y[:, 1::2, :] += 0.95
z[:, :, 1::2] += 0.95

(filled_2.shape) + 1の形状の、要素として各配列のindexをもつ配列を作成して、その値を2でわって切り捨てにした要素をもつ配列をつくる。
各要素の+0.05などをして、うまいこと隙間を開けていく。

アニメーションの設定

def update(_):
ax.cla()
cycle = plt.rcParams['axes.prop_cycle'].by_key()['color']
col1= str(np.random.choice(cycle))
col2= str(np.random.choice(cycle))
facecolors = np.where(n_voxels,col1,col2)
fcolors_2 = explode(facecolors)
ax.axis('off')
ax.voxels(x, y, z, filled_2, facecolors=fcolors_2, edgecolors=ecolors_2)

ここでは、カラーサイクルのリストから色をランダムに選択する手法をとる。

カラーサイクルとは、複数のデータをプロットした時に自動的に設定される色のことで、 plt.rcParams[‘axes.prop_cycle’].by_key()[‘color’]とすることでリスト形式で取り出すことができる。

このリストの中からひとつをnp.random.choice(cycle)とすることで取り出し、col1, col2を設定する。そして、col1, col2をnp.where()により、TrueとFalseの位置にそれぞれ設定する。

ax.voxels(x, y, z, filled_2, facecolors=fcolors_2, edgecolors=ecolors_2)でボクセルグラフを表示する。x,y,zがボクセルの左手前下の座標、filled_2で色をつける位置を指定している。

アニメーションの表示

ani = animation.FuncAnimation(fig, update, 25, interval=200)
HTML(ani.to_html5_video())

25stepアニメーション関数を実行して、200 ms間隔で順次図をかえていくので、5 secのアニメーションとなる。
HTML(ani.to_html5_video())とすればjupyter notebook上にアニメーションを表示できる。

コードをダウンロード(.pyファイル)

コードをダウンロード(.ipynbファイル)

参考

mpl_toolkits.mplot3d.axes3d.Axes3D — Matplotlib 3.5.0 documentation
[matplotlib animation] 46. Voxelで作成したNumPyロゴの色変化アニメーション(グレースケール)
Voxelグラフで作成したNumPyロゴの色をグレースケールで変化させたアニメーションをmatplotlib FuncAnimationで表示する。
matplotlibでcolor cycleのN番目の色を指定するいくつかの方法 - Qiita
実際の活用場面に即したタイトルにすると__「同じ図に複数データをプロットする際にcolor cycleから同じ色を指定する方法」とでもなりますが、少し一般性を持たせるためにどういう作業をするかに注目…
301 Moved Permanently

コメント