はじめに
この記事では、matplotlibライブラリを使用して時系列データをグラフ化する際に、x軸の日付ラベルを簡潔かつ読みやすく表示するためのConciseDateFormatterの使い方について解説します。時系列グラフの見栄えを良くし、情報を効果的に伝えるためのテクニックを紹介していきます。
コード
解説
モジュールのインポート
バージョン
データの生成
dates = np.array([base + datetime.timedelta(hours=(0.5*i)) for i in range(24*256)])で、baseの日付から0.5時間刻みで時間を増加させた配列が得られます。これにより、24 × 256 = 6144個の時間ポイントが生成されます。
表示範囲の設定
デフォルト設定の時系列グラフ
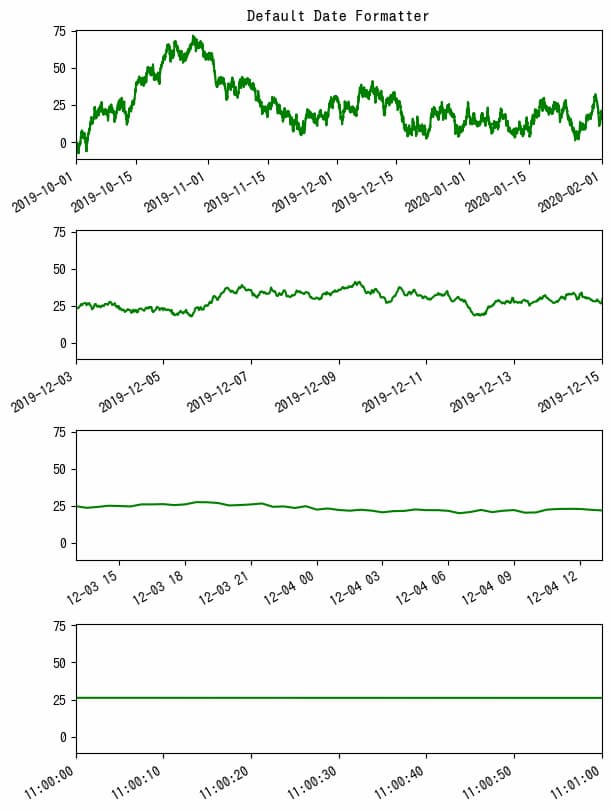
時間の表示範囲によって目盛りラベルは変化しますが、基本的にどれも長いため、重なりを防ぐ必要があります。この例では、label.set_rotation(30)を使用して30°回転させています。
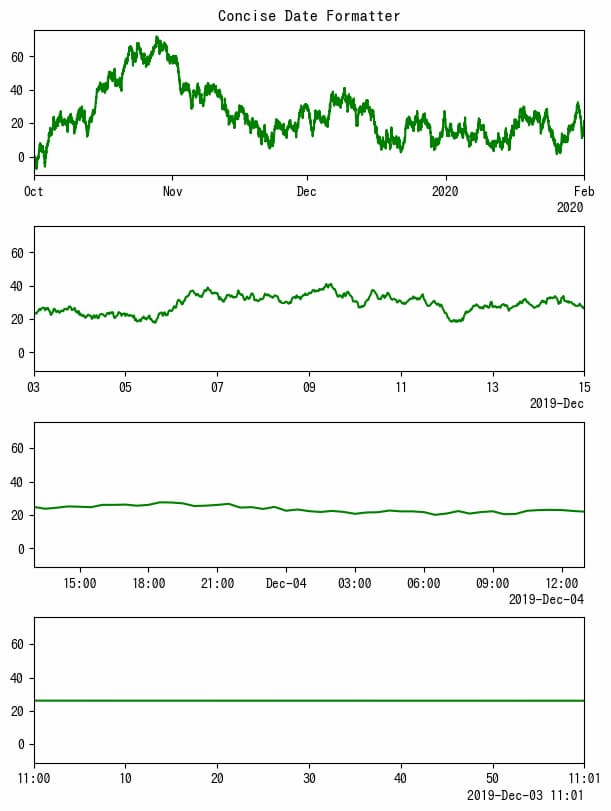
ConciseDateFormatterを使った時系列グラフ
最初に、locator = mdates.AutoDateLocator(minticks=4, maxticks=9)で目盛りの最小数と最大数を設定します。次に、formatter = mdates.ConciseDateFormatter(locator)でConciseDateFormatterをlocatorに適用します。これらの設定をグラフに反映させるには、ax.xaxis.set_major_locator(locator)とax.xaxis.set_major_formatter(formatter)を実行する必要があります。
units registryを使ってConciseDateFormatterを適用させる方法
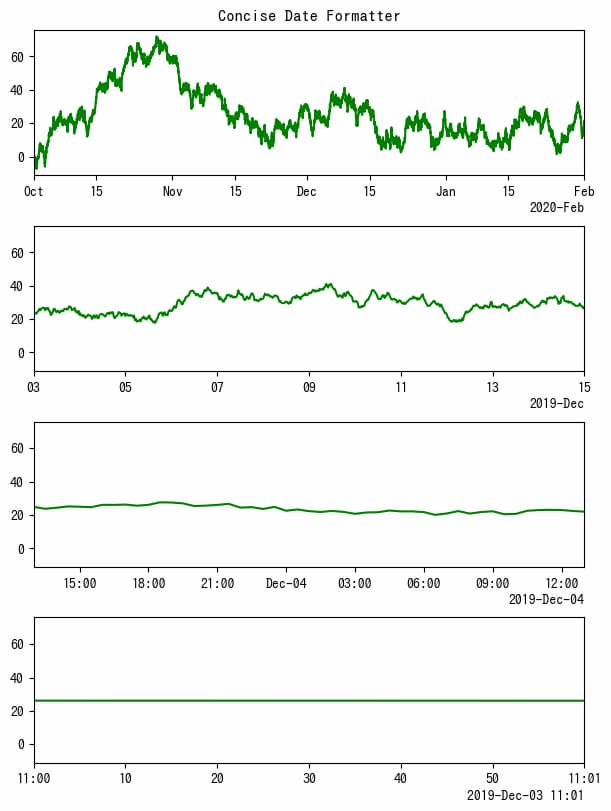
converter = mdates.ConciseDateConverter()を設定し、munits.registry[np.datetime64] = converterを実行しておくと、set_major_formatterなどを使う必要がなくなり、より簡単に軸ラベルを簡素化できます。
参考


コメント