はじめに
このブログ記事では、Jupyter Notebookの対話的ウィジェット機能であるipywidgetsのIntRangeSliderを使って、画像の表示範囲をリアルタイムで調整する方法について解説します。この手法を使うことで、データ可視化の効果を高め、画像解析をより直感的に行うことができます。
コード
解説
モジュールのインポートなど
データの生成
画像データは下記記事と同じコードにより生成しました。
[matplotlib] 57. imshow使用時に軸を画像から離して表示する方法
matplotlibのplt.imshowで画像表示する際に軸を画像から離して配置する方法を解説します。tick_paramsとspinesの設定で軸の位置を調整し、視認性を高めるテクニックを紹介します。
sabopy.com
2020.01.23
画像の表示
ipywidgetsの設定
IntRangeSliderの設定
IntRangeSliderでは整数の範囲を指定できます。minは最小値、maxは最大値、stepは刻み幅、valueは初期値を設定します。descriptionを使用するとスライダーの前にラベルを表示でき、orientationパラメータでスライダーの方向を制御できます(’horizontal’で水平方向、’vertical’で垂直方向)。
IntRangeSliderの表示
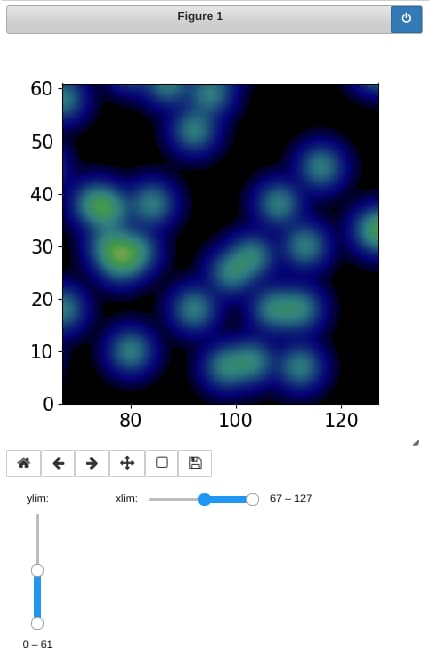
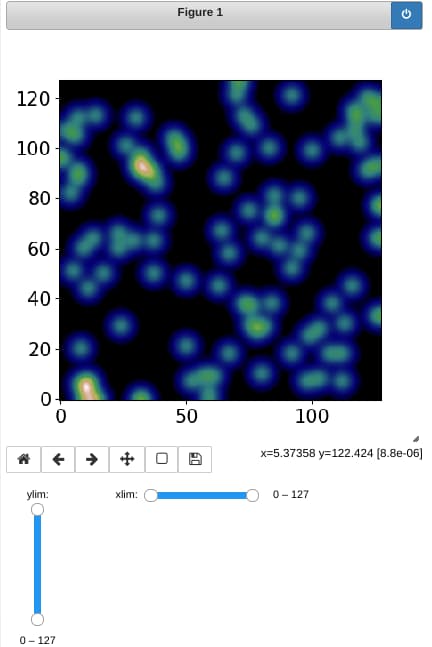
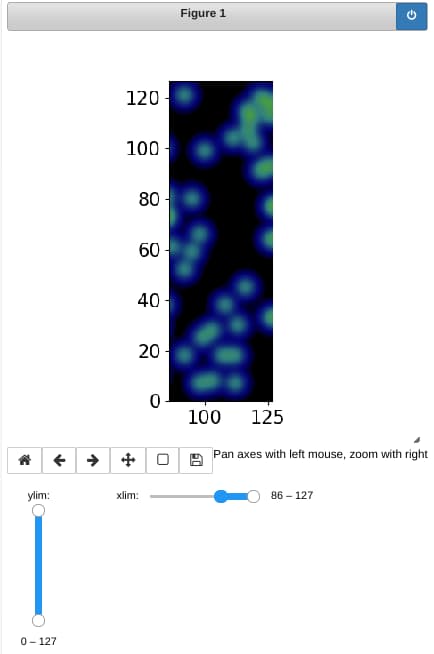
x_rangeとy_rangeのスライダーで選択した範囲を、xlimとylimに設定します。
この機能を実装する際は、interactではなく、interactiveを使用します。
interactiveを使用することで、HBox(children=[y_range,x_range])のようにipywidgetsのレイアウトを柔軟に変更できます。
HBoxを使用すると、ウィジェットを横方向に並べて表示できます。
x_range、y_rangeを変化させたときの画像の変化
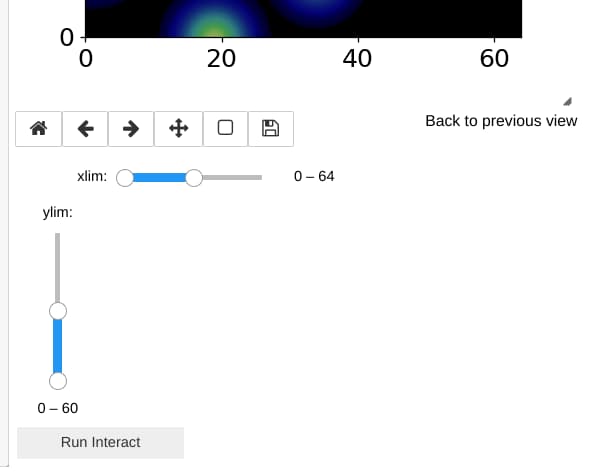
{‘manual’: True}によるRun Interactボタンの設置
ipywidgetsのinteractiveパラメータに{‘manual’: True}を設定すると、下の画像のように「Run Interact」ボタンが表示されます。このボタンをクリックすることで、スライダーで調整した値が反映されます。
参考

Using Interact — Jupyter Widgets 8.1.8 documentation
ipywidgets.readthedocs.io

Widget List — Jupyter Widgets 8.1.8 documentation
ipywidgets.readthedocs.io
コメント