はじめに
この記事では、ipywidgetsのColorPickerを使用して色を選択し、クリックによってマーカーを着色する方法を解説します。また、色ごとに集計した結果を棒グラフで表示する実装方法も紹介します。
コード
解説
モジュールのインポートなど
%matplotlibでjupyter lab, notebook内ではなく、別ウインドウでQt5Aggのbackendにより表示します。
バージョン
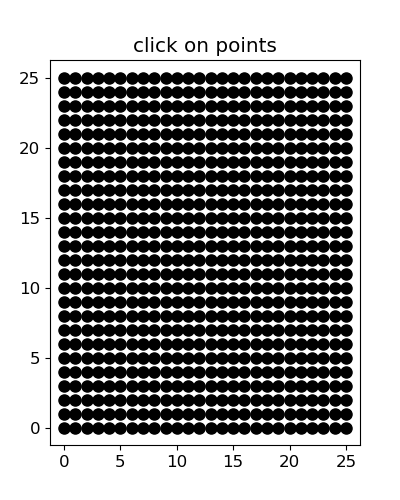
データの生成
np.meshgridでgrid状のデータを作成する。図示すると以下のようになります。
データの加工
xの値が1以下または24以上の場合はnp.nanに設定します。また、xの偶数行において、インデックスが2の位置をnp.nanにし、-0.5の調整を加えることでマーカーの位置をずらします。
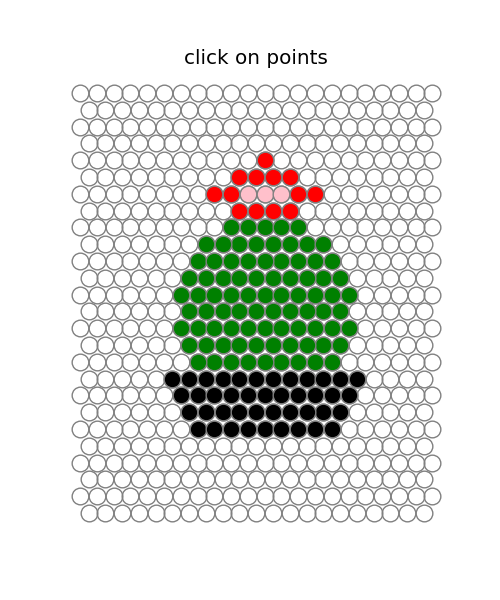
図の表示
ColorPickerの表示
ColorPickerでは、色のついた四角をクリックすると表示されるカラーピッカーウィンドウから色を選択できます。また、「pink」などの色名を直接入力することでも色を指定することが可能です。
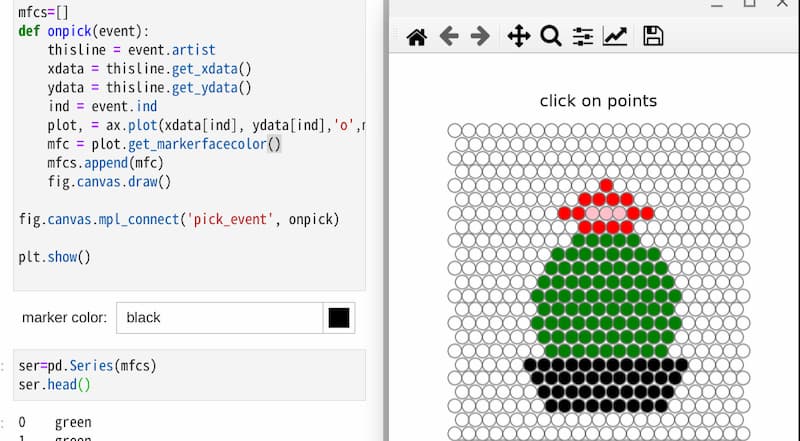
onpickイベントの設定
まず、マーカーの色を格納するための空のリスト(mfcs)を作成します。クリックしたマーカーの座標を取得するには、event.artistをthislineとして参照し、get_xdata()とget_ydata()でデータ配列を取得した後、event.indでインデックスを特定します。
カラーピッカーで選択した色をクリックしたマーカーに適用するには、ax.plot()内でmfc=”+colp.value+”と指定します。
plot.get_markerfacecolor()を使ってマーカーの色を取得し、後の集計のためにリストに追加します。
fig.canvas.draw()を実行して図を更新します。
fig.canvas.mpl_connect(‘pick_event’, onpick)でクリックイベントの検出と処理を有効にします。
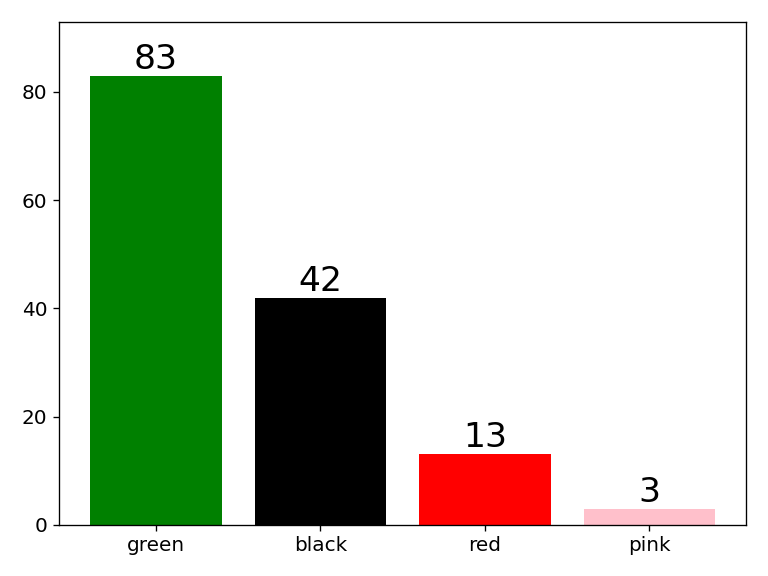
色の集計
pandas の pd.Series() を使って list をシリーズに変換し、そのシリーズに対して .value_counts() メソッドを適用することで、各要素の出現回数を集計しました。
集計結果の表示
plt.bar()を使用して棒グラフを表示します。color=counts.indexを設定することで、インデックスの色をそのまま棒グラフの色として適用しました。また、plt.text()を使用して、各棒グラフの上に対応する値を表示しています。
コードをダウンロード(.pyファイル) コードをダウンロード(.ipynbファイル)まとめ
本記事では、matplotlib とipywidgetsを組み合わせて、ColorPickerによる色選択とマーカークリックによる着色機能、さらに色ごとの集計結果を棒グラフで表示する方法を解説しました。この手法を活用することで、インタラクティブなデータ分析や可視化が可能になります。
参考


コメント