 matplotlib
 [matplotlib] 57. imshow使用時に軸を画像から離して表示する方法
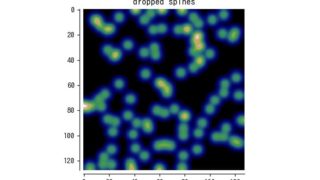
matplotlibのplt.imshowで画像表示する際に軸を画像から離して配置する方法を解説します。tick_paramsとspinesの設定で軸の位置を調整し、視認性を高めるテクニックを紹介します。
 matplotlib
  matplotlib
  matplotlib
  matplotlib
  matplotlib
  matplotlib
  matplotlib
  matplotlib