 jupyter notebook, lab
 [matplotlib] 91. マウスオーバーイベントで九九表(Multiplication tables)
matplotlibのaxes_enter_eventとaxes_leave_eventを使用してインタラクティブな九九表を作成する方法を解説。マウスオーバーで答えが表示される仕組みと、背景色の変更によるビジュアルフィードバックの実装方法について詳しく説明しています。
jupyter notebook, lab  matplotlib
  ipywidgets
 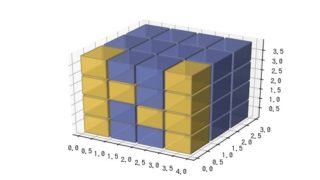 NumPy NumPy
 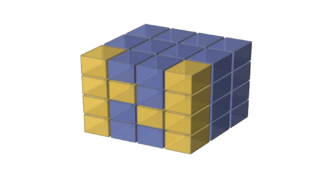 NumPy
NumPy 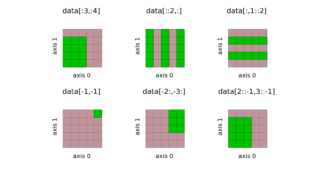 matplotlib 3D
 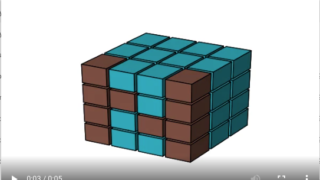 matplotlib 3D