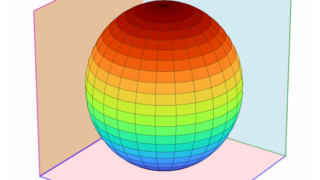
python

matplotlib

[matplotlib animation] 88. imshowでのcmap変化アニメーション

plt.imshowで表示した画像のカラーマップを変化させたときの色の変化をmatplotlibのFuncAnimationによるアニメーションで表示する。
matplotlib

[scikit-image] 88. threshold_sauvola, opening, label, regionpropsなどを駆使してサボテンの種の数を調査

skimage.filters, morphology, measureなどを使用して、サボテンの種の数を調べたのでその詳細を解説する。
matplotlib

[matplotlib animation] 87. 円の多角形近似のresolution変化アニメーション

matplotlibのFuncAnimationでpatches.CirclePolygonのresolutionを変化させたときの多角形の変化をアニメーションで表示する。
matplotlib

[matplotlib] 90. ラベルの位置の調整(ax.set_xlabelのloc)

matplotlibでx軸, y軸の位置を調整する方法について説明する。
matplotlib

[matplotlib] 89. 図中に任意の傾きの線を表示する(axline)

matplotlibで図全体に表示される任意の傾きの線を表示する方法について説明する。
ipywidgets

[ipywidgets] 30. 3Dプロットのアスペクト比をIntSliderで調整(set_box_aspect)

ipywidgetsのIntSliderをつかって、matplotlibの3Dプロットのアスペクト比をインタラクティブに変更する方法について説明する。
matplotlib

[matplotlib] 88. 強調線(集中線)

matplotlibで強調線を表示する方法について説明する。
matplotlib

[matplotlib animation] 86.円の接線のアニメーション

matplotlibのFuncAnimationで円の接線を表示するアニメーションを作成する。