はじめに
fitbitとは、心拍数、歩数や睡眠をトラッキングするために腕に着用するタイプのスマートウォッチです。ここでは、Fitbit APIを使って一年分の睡眠時間を取得し、matplotlibのヒストグラムにより表示する方法を解説します。
手順
APIの登録など
その1を参照してください。
fitbit-pythonのインストールなど
その2を参照してください。
モジュールのインポートなど
This file contains bidirectional Unicode text that may be interpreted or compiled differently than what appears below. To review, open the file in an editor that reveals hidden Unicode characters.
Learn more about bidirectional Unicode characters
import fitbit
from ast import literal_eval
import pandas as pd
import matplotlib.pyplot as plt
import matplotlib.dates as mdates
import numpy as np
import seaborn as sns
import datetime as dt
plt.style.use('ggplot')
バージョン
This file contains bidirectional Unicode text that may be interpreted or compiled differently than what appears below. To review, open the file in an editor that reveals hidden Unicode characters.
Learn more about bidirectional Unicode characters
#version
import matplotlib
print(matplotlib.__version__)
3.4.2
print(fitbit.__version__)
0.3.1
print(pd.__version__)
1.2.4
print(np.__version__)
1.20.3
print(sns.__version__)
0.11.1
APIの認証
CLIENT_ID, tokenなどを定義
This file contains bidirectional Unicode text that may be interpreted or compiled differently than what appears below. To review, open the file in an editor that reveals hidden Unicode characters.
Learn more about bidirectional Unicode characters
CLIENT_ID = "#####"
CLIENT_SECRET = "################"
TOKEN_FILE = "token.txt"
tokens = open(TOKEN_FILE).read()
token_dict = literal_eval(tokens)
access_token = token_dict['access_token']
refresh_token = token_dict['refresh_token']
その1で取得したCLIENT_IDとCLIENT_SECRETとtoken.txtをここで使います。token.txtは実行ファイルと同じ場所に置いておきます。
認証
This file contains bidirectional Unicode text that may be interpreted or compiled differently than what appears below. To review, open the file in an editor that reveals hidden Unicode characters.
Learn more about bidirectional Unicode characters
def updateToken(token):
f = open(TOKEN_FILE, 'w')
f.write(str(token))
f.close()
return
client = fitbit.Fitbit(CLIENT_ID, CLIENT_SECRET,
access_token = access_token, refresh_token = refresh_token, refresh_cb = updateToken)
fitbit.Fitbit()
により、認証を行います。updateToken
関数はtokenの更新用の関数でrefresh_cb
に updateToken
とすることでtokenが期限切れの際に随時更新してくれるようになります。
1年分のデータの取得
日付の設定
This file contains bidirectional Unicode text that may be interpreted or compiled differently than what appears below. To review, open the file in an editor that reveals hidden Unicode characters.
Learn more about bidirectional Unicode characters
#日付の設定
DATE_s = "2020-01-01"
DATE_e = "2020-12-31"
DATE_s = dt.datetime.strptime(DATE_s, '%Y-%m-%d')
DATE_e = dt.datetime.strptime(DATE_e, '%Y-%m-%d')
2020年の最初と最後の日をそれぞれdatetime形式で作成します。
100 日間ごとに日付範囲を分ける
一度に取得することのできる日数は100日までです。100日以上の日付範囲を指定すると、
This file contains bidirectional Unicode text that may be interpreted or compiled differently than what appears below. To review, open the file in an editor that reveals hidden Unicode characters.
Learn more about bidirectional Unicode characters
#HTTPBadRequest: Max date range is 100 days
となります。そこで、以下のコードで100日ごとの日付範囲をタプルで作成します。
This file contains bidirectional Unicode text that may be interpreted or compiled differently than what appears below. To review, open the file in an editor that reveals hidden Unicode characters.
Learn more about bidirectional Unicode characters
date_ranges = []
start_range = DATE_s
while start_range < DATE_e:
if start_range+dt.timedelta(days=100) < DATE_e:
date_ranges.append((start_range, start_range+dt.timedelta(days=100)))
start_range = start_range+dt.timedelta(days=101)
else:
date_ranges.append((start_range, DATE_e))
start_range = DATE_e
date_ranges
"""
[(datetime.datetime(2020, 1, 1, 0, 0), datetime.datetime(2020, 4, 10, 0, 0)),
(datetime.datetime(2020, 4, 11, 0, 0), datetime.datetime(2020, 7, 20, 0, 0)),
(datetime.datetime(2020, 7, 21, 0, 0), datetime.datetime(2020, 10, 29, 0, 0)),
(datetime.datetime(2020, 10, 30, 0, 0),
datetime.datetime(2020, 12, 31, 0, 0))]
"""
睡眠データの取得
This file contains bidirectional Unicode text that may be interpreted or compiled differently than what appears below. To review, open the file in an editor that reveals hidden Unicode characters.
Learn more about bidirectional Unicode characters
all_data = []
for date_range in date_ranges:
print(f"Requesting data for {date_range[0].strftime('%Y-%m-%d')} to {date_range[1].strftime('%Y-%m-%d')}.")
range_data = client.time_series("sleep", base_date=date_range[0],end_date=date_range[1])
all_data.append(range_data)
print("Success!!")
"""
Requesting data for 2020-01-01 to 2020-04-10.
Success!!
Requesting data for 2020-04-11 to 2020-07-20.
Success!!
Requesting data for 2020-07-21 to 2020-10-29.
Success!!
Requesting data for 2020-10-30 to 2020-12-31.
Success!!
"""
client.time_series()によって睡眠データを取得します。base_dateとend_dateに先ほど作成したタプルの値が入るようにfor文を回し、結果をリストに入れていきます。
睡眠データから睡眠時間の抽出
This file contains bidirectional Unicode text that may be interpreted or compiled differently than what appears below. To review, open the file in an editor that reveals hidden Unicode characters.
Learn more about bidirectional Unicode characters
sleep_duration = [[all_data[j]["sleep"][i]["duration"] for i in range(len(all_data[j]["sleep"]))] for j in range(len(date_ranges))]
sleep_duration_2020=np.array([])
for i in range(len(date_ranges)):
sleep_duration_2020 = np.append(sleep_duration_2020, sleep_duration[i])
睡眠時間は”duration”の値となります。睡眠データリストの中から、睡眠時間のみを取り出し、睡眠時間リストを作成します。
リストの形状は、365以上のなので、昼寝の分も含まれていると思われます。
This file contains bidirectional Unicode text that may be interpreted or compiled differently than what appears below. To review, open the file in an editor that reveals hidden Unicode characters.
Learn more about bidirectional Unicode characters
sleep_duration_2020.shape
#(397,)
1年間の睡眠時間の要約統計量の表示
睡眠時間を時間(hour)に変換し、pandasのdescribeで要約統計量を表示すると以下のようになります。
This file contains bidirectional Unicode text that may be interpreted or compiled differently than what appears below. To review, open the file in an editor that reveals hidden Unicode characters.
Learn more about bidirectional Unicode characters
sleep_duration_2020_h =sleep_duration_2020/1000/60/60
pd.DataFrame(sleep_duration_2020_h).describe().T
"""
count mean std min 25% 50% 75% max
0 397.0 6.764987 1.850108 1.0 6.316667 6.983333 7.533333 11.7
"""
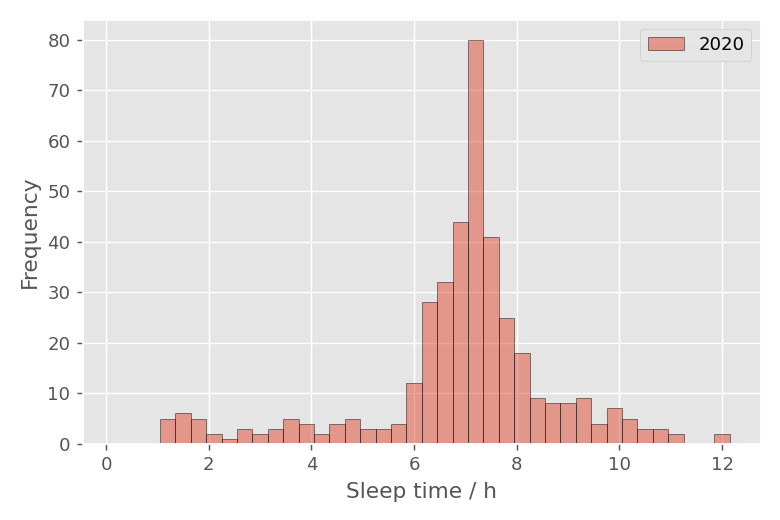
睡眠時間分布をヒストグラムで表示
睡眠時間データに対して、np.histogramでヒストグラムデータを作成し、matplotlibのbarグラフでヒストグラムを作成しました。
This file contains bidirectional Unicode text that may be interpreted or compiled differently than what appears below. To review, open the file in an editor that reveals hidden Unicode characters.
Learn more about bidirectional Unicode characters
bins = np.linspace(0,12,41)
hist0, bins0 = np.histogram(sleep_duration_2020_h, bins=bins)
bins0=bins0[1:]
width=bins0[1]-bins0[0]
fig,ax=plt.subplots(dpi=120,figsize=(6,4))
ax.bar(bins0,hist0,width=width,alpha=.5,ec="k",label="2020",fc="C0")
ax.legend()
ax.set(xlabel="Sleep time / h",ylabel="Frequency")
plt.tight_layout()
plt.savefig("histogram_sleeptime2020.png",dpi=130)
plt.show()
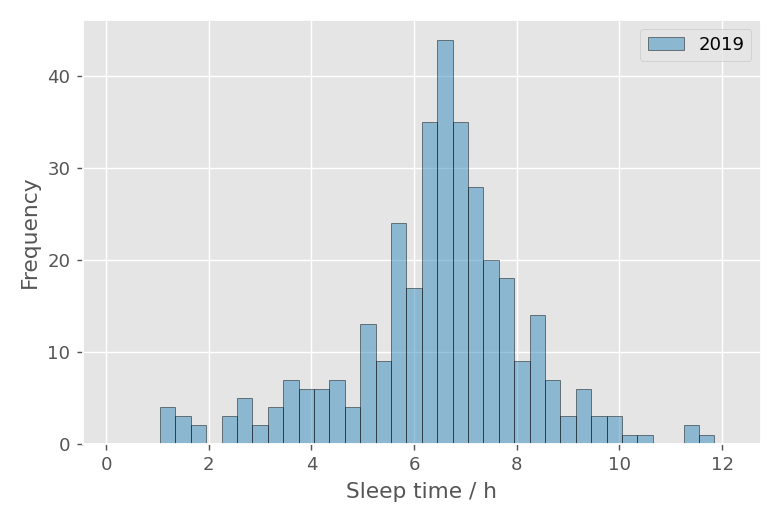
2019年の睡眠時間ヒストグラム
同様の方法で2019年の睡眠時間ヒストグラムを作成すると以下のようになります。
This file contains bidirectional Unicode text that may be interpreted or compiled differently than what appears below. To review, open the file in an editor that reveals hidden Unicode characters.
Learn more about bidirectional Unicode characters
#2019
DATE_s = "2019-01-01"
DATE_e = "2019-12-31"
DATE_s = dt.datetime.strptime(DATE_s, '%Y-%m-%d')
DATE_e = dt.datetime.strptime(DATE_e, '%Y-%m-%d')
# Create a series of 100-day date-range tuples between start_date and end_date
date_ranges = []
start_range = DATE_s
while start_range < DATE_e:
if start_range+dt.timedelta(days=100) < DATE_e:
date_ranges.append((start_range, start_range+dt.timedelta(days=100)))
start_range = start_range+dt.timedelta(days=101)
else:
date_ranges.append((start_range, DATE_e))
start_range = DATE_e
all_data = []
for date_range in date_ranges:
print(f"Requesting data for {date_range[0].strftime('%Y-%m-%d')} to {date_range[1].strftime('%Y-%m-%d')}.")
range_data = client.time_series("sleep", base_date=date_range[0],end_date=date_range[1])
all_data.append(range_data)
print("Success!!")
sleep_duration = [[all_data[j]["sleep"][i]["duration"] for i in range(len(all_data[j]["sleep"]))] for j in range(len(date_ranges))]
sleep_duration_2019=np.array([])
for i in range(len(date_ranges)):
sleep_duration_2019 = np.append(sleep_duration_2019, sleep_duration[i])
sleep_duration_2019_h =sleep_duration_2019/1000/60/60
pd.DataFrame(sleep_duration_2019_h).describe().T
bins = np.linspace(0,12,41)
hist1, bins1 = np.histogram(sleep_duration_2019_h, bins=bins)
bins1=bins1[1:]
width=bins1[1]-bins1[0]
fig,ax=plt.subplots(dpi=120,figsize=(6,4))
ax.bar(bins1,hist1,width=width,alpha=.5,ec="k",label="2019",fc="C1")
ax.legend()
ax.set(xlabel="Sleep time / h",ylabel="Frequency")
plt.tight_layout()
plt.savefig("histogram_sleeptime2019.png",dpi=130)
plt.show()
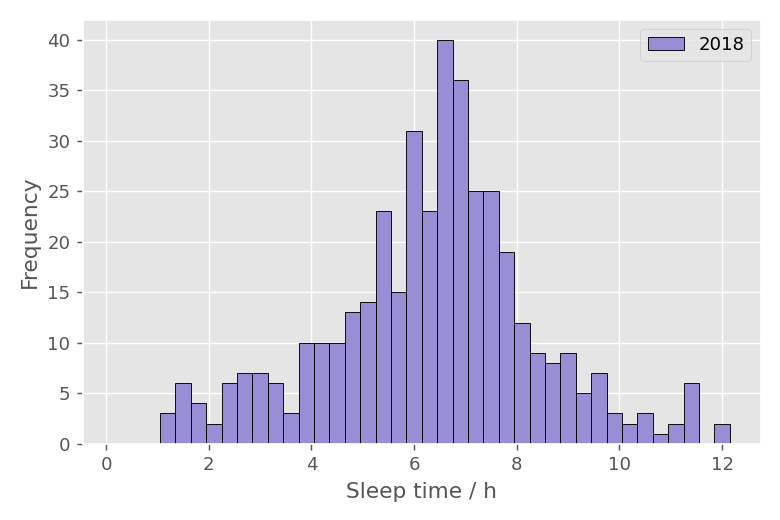
2018年の睡眠時間ヒストグラム
2018年の睡眠時間ヒストグラムは以下のようになります。
This file contains bidirectional Unicode text that may be interpreted or compiled differently than what appears below. To review, open the file in an editor that reveals hidden Unicode characters.
Learn more about bidirectional Unicode characters
#2018
DATE_s = "2018-01-01"
DATE_e = "2018-12-31"
DATE_s = dt.datetime.strptime(DATE_s, '%Y-%m-%d')
DATE_e = dt.datetime.strptime(DATE_e, '%Y-%m-%d')
# Create a series of 100-day date-range tuples between start_date and end_date
date_ranges = []
start_range = DATE_s
while start_range < DATE_e:
if start_range+dt.timedelta(days=100) < DATE_e:
date_ranges.append((start_range, start_range+dt.timedelta(days=100)))
start_range = start_range+dt.timedelta(days=101)
else:
date_ranges.append((start_range, DATE_e))
start_range = DATE_e
all_data = []
for date_range in date_ranges:
print(f"Requesting data for {date_range[0].strftime('%Y-%m-%d')} to {date_range[1].strftime('%Y-%m-%d')}.")
range_data = client.time_series("sleep", base_date=date_range[0],end_date=date_range[1])
all_data.append(range_data)
print("Success!!")
sleep_duration = [[all_data[j]["sleep"][i]["duration"] for i in range(len(all_data[j]["sleep"]))] for j in range(len(date_ranges))]
sleep_duration_2018=np.array([])
for i in range(len(date_ranges)):
sleep_duration_2018 = np.append(sleep_duration_2018, sleep_duration[i])
sleep_duration_2018_h =sleep_duration_2018/1000/60/60
#pd.DataFrame(sleep_duration_2018_h).describe().T
bins = np.linspace(0,12,41)
hist2, bins2 = np.histogram(sleep_duration_2018_h, bins=bins)
bins2=bins2[1:]
width=bins2[1]-bins2[0]
fig,ax=plt.subplots(dpi=120,figsize=(6,4))
ax.bar(bins2,hist2,width=width,alpha=1,ec="k",fc="C2",label="2018")
ax.legend()
ax.set(xlabel="Sleep time / h",ylabel="Frequency")
plt.tight_layout()
plt.savefig("histogram_sleeptime2018.png",dpi=130)
plt.show()
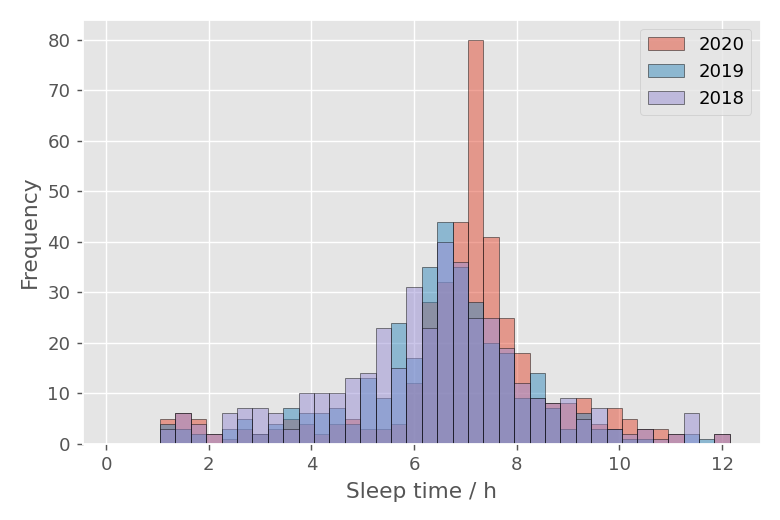
睡眠時間ヒストグラムをまとめて表示
2018年から2020年のヒストグラムをまとめて表示すると以下のようになります。
This file contains bidirectional Unicode text that may be interpreted or compiled differently than what appears below. To review, open the file in an editor that reveals hidden Unicode characters.
Learn more about bidirectional Unicode characters
# まとめて表示
fig,ax=plt.subplots(dpi=120,figsize=(6,4))
ax.bar(bins0,hist0,width=width,alpha=.5,ec="k",label="2020")
ax.bar(bins1,hist1,width=width,alpha=.5,ec="k",label="2019")
ax.bar(bins2,hist2,width=width,alpha=.5,ec="k",label="2018")
ax.set(xlabel="Sleep time / h",ylabel="Frequency")
ax.legend()
plt.tight_layout()
plt.savefig("histogram_sleeptime_from2018to2020.png",dpi=130)
plt.show()
コードをダウンロード(.pyファイル)
コードをダウンロード(.ipynbファイル)
コメント