Processing math: 100%

[lmfit] 20. 重み付き最小二乗法ガウシアンフィッティング

lmfit

はじめに

lmfitは非線形最小二乗法を用いてカーブフィットするためのライブラリであり、Scipy.optimize.curve_fitの拡張版に位置する。ここでは、データを重み付きガウス分布関数モデルによりカーブフィッティングする方法について説明する。

コード

import matplotlib.pyplot as plt
import numpy as np
from numpy.random import default_rng
from lmfit.models import GaussianModel
rng = default_rng()
data = rng.normal(0,1,10000)
y,x = np.histogram(data,range=(-5,5),bins=100,density=True)
x=x[1:]
fig, ax = plt.subplots(dpi=100)
ax.plot(x,y,"o")
ax.set(xlabel="x",ylabel="y")
plt.savefig("lmfit20_1.png",dpi=130)
plt.show()
y[:20]+=rng.random(len(y[:20]))/2
y[-20:]+=rng.random(len(y[-20:]))/2
fig, ax = plt.subplots(dpi=100)
ax.plot(x,y,"o")
ax.set(xlabel="x",ylabel="y")
plt.savefig("lmfit20_2.png",dpi=130)
plt.show()
model = GaussianModel()
params = model.guess(y, x=x)
params
"""
name value initial value min max vary expression
amplitude 7.33859625 None -inf inf True
center -0.31590909 None -inf inf True
sigma 4.90000000 None 0.00000000 inf True
fwhm 11.5386180 None -inf inf False 2.3548200*sigma
height 0.59748499 None -inf inf False 0.3989423*amplitude/max(1e-15, sigma)
"""
result = model.fit(y, params, x=x)
print(result.fit_report())
"""
[[Model]]
Model(gaussian)
[[Fit Statistics]]
# fitting method = leastsq
# function evals = 2503
# data points = 100
# variables = 3
chi-square = 2.13333145
reduced chi-square = 0.02199311
Akaike info crit = -378.748537
Bayesian info crit = -370.933026
[[Variables]]
amplitude: 45462508.4 +/- 1.6490e+11 (362709.92%) (init = 7.338596)
center: -603.281764 +/- 157294.736 (26073.18%) (init = -0.3159091)
sigma: 115.916638 +/- 15122.6351 (13046.13%) (init = 4.9)
fwhm: 272.962817 +/- 35611.0838 (13046.13%) == '2.3548200*sigma'
height: 156465.180 +/- 5.4710e+08 (349663.90%) == '0.3989423*amplitude/max(1e-15, sigma)'
[[Correlations]] (unreported correlations are < 0.100)
C(amplitude, center) = -1.000
C(center, sigma) = -1.000
C(amplitude, sigma) = 1.000
"""
fig, ax = plt.subplots(dpi=130)
result.plot_fit(ax=ax)
plt.savefig("lmfit20_3.png",dpi=130)
plt.show()
weights=np.ones(100)*100
weights[:20]=20
weights[-20:]=20
weights
"""
array([ 20., 20., 20., 20., 20., 20., 20., 20., 20., 20., 20.,
20., 20., 20., 20., 20., 20., 20., 20., 20., 100., 100.,
100., 100., 100., 100., 100., 100., 100., 100., 100., 100., 100.,
100., 100., 100., 100., 100., 100., 100., 100., 100., 100., 100.,
100., 100., 100., 100., 100., 100., 100., 100., 100., 100., 100.,
100., 100., 100., 100., 100., 100., 100., 100., 100., 100., 100.,
100., 100., 100., 100., 100., 100., 100., 100., 100., 100., 100.,
100., 100., 100., 20., 20., 20., 20., 20., 20., 20., 20.,
20., 20., 20., 20., 20., 20., 20., 20., 20., 20., 20.,
20.])
"""
params = model.guess(y, x=x)
result = model.fit(y, params, x=x,weights=weights)
print(result.fit_report())
"""
[[Model]]
Model(gaussian)
[[Fit Statistics]]
# fitting method = leastsq
# function evals = 40
# data points = 100
# variables = 3
chi-square = 1551.83004
reduced chi-square = 15.9982478
Akaike info crit = 280.202000
Bayesian info crit = 288.017510
[[Variables]]
amplitude: 0.99870955 +/- 0.02905524 (2.91%) (init = 7.338596)
center: 0.05738596 +/- 0.03327650 (57.99%) (init = -0.3159091)
sigma: 0.99105587 +/- 0.03332575 (3.36%) (init = 4.9)
fwhm: 2.33375819 +/- 0.07847613 (3.36%) == '2.3548200*sigma'
height: 0.40202323 +/- 0.01169331 (2.91%) == '0.3989423*amplitude/max(1e-15, sigma)'
[[Correlations]] (unreported correlations are < 0.100)
C(amplitude, sigma) = 0.578
"""
fig, ax = plt.subplots(dpi=130)
result.plot_fit(ax=ax,data_kws=dict(alpha=0.8),fit_kws=dict(zorder=13))
plt.savefig("lmfit20_4.png",dpi=130)
plt.show()
view raw lmfit20.py hosted with ❤ by GitHub

解説

モジュールのインポート

import matplotlib.pyplot as plt
import numpy as np
from numpy.random import default_rng
from lmfit.models import GaussianModel
view raw lmfit20.py hosted with ❤ by GitHub

バージョン

#version
import matplotlib
print(matplotlib.__version__)
3.3.4
import lmfit
print(lmfit.__version__)
1.0.2
print(np.__version__)
1.20.1
view raw lmfit20.py hosted with ❤ by GitHub

データの生成

rng = default_rng()
data = rng.normal(0,1,10000)
y,x = np.histogram(data,range=(-5,5),bins=100,density=True)
x=x[1:]
view raw lmfit20.py hosted with ❤ by GitHub

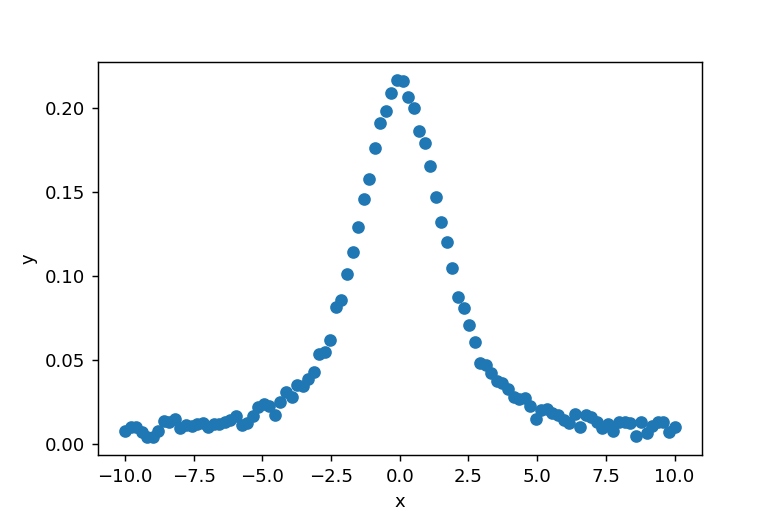
rng = default_rng()とし、rng.normal(0,1,10000)で標準正規分布に従うランダムデータを10000こ作成する。xとyの関係を図で示すと以下のようになる。

fig, ax = plt.subplots(dpi=100)
ax.plot(x,y,"o")
ax.set(xlabel="x",ylabel="y")
plt.savefig("lmfit20_1.png",dpi=130)
plt.show()
view raw lmfit20.py hosted with ❤ by GitHub

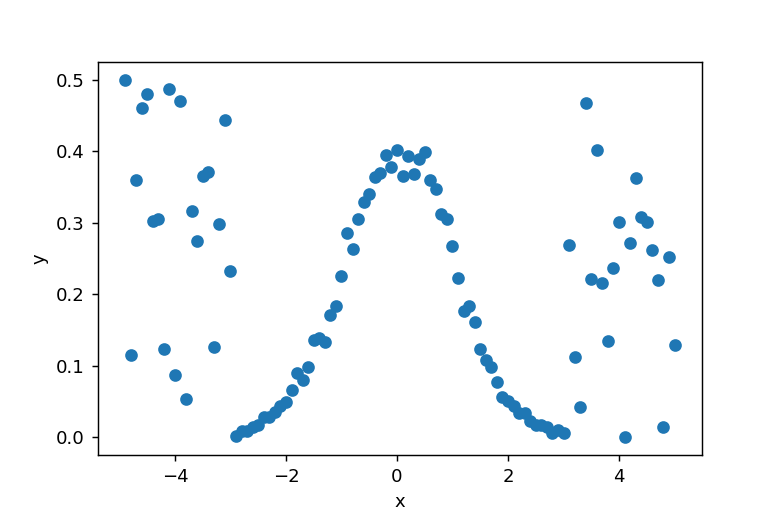
y値に両端の20こ目までランダムなデータを付加する。xとyの関係を図で示すと以下のようになる。

y[:20]+=rng.random(len(y[:20]))/2
y[-20:]+=rng.random(len(y[-20:]))/2
view raw lmfit20.py hosted with ❤ by GitHub
fig, ax = plt.subplots(dpi=100)
ax.plot(x,y,"o")
ax.set(xlabel="x",ylabel="y")
plt.savefig("lmfit20_2.png",dpi=130)
plt.show()
view raw lmfit20.py hosted with ❤ by GitHub

モデルの定義

model = GaussianModel()
view raw lmfit20.py hosted with ❤ by GitHub

lmfit.modelsGaussianModelをモデル関数として用いる。Gaussian関数は以下の式で表される。パラメータはamplitude, center, sigmaとなる。

f(x; A, \mu, \sigma) = \frac{A}{\sigma\sqrt{2\pi}} e^{[{-{(x-\mu)^2}/{{2\sigma}^2}}]}

初期パタメータの推定

params = model.guess(y, x=x)
view raw lmfit20.py hosted with ❤ by GitHub

model.guess(y, x=x)により、上図のデータをガウス関数モデルで近似するためのフィッティングパラメータについて、初期値を推定する。パラメータ(params)は以下のようになる。

params
"""
name value initial value min max vary expression
amplitude 7.33859625 None -inf inf True
center -0.31590909 None -inf inf True
sigma 4.90000000 None 0.00000000 inf True
fwhm 11.5386180 None -inf inf False 2.3548200*sigma
height 0.59748499 None -inf inf False 0.3989423*amplitude/max(1e-15, sigma)
"""
view raw lmfit20.py hosted with ❤ by GitHub

カーブフィット

result = model.fit(y, params, x=x)
view raw lmfit20.py hosted with ❤ by GitHub

model.fit(y, params, x=x)により、カーブフィッティングを実行する。

フィッティング結果の表示

print(result.fit_report())により、フィッティングの結果を見ることができる。

print(result.fit_report())
"""
[[Model]]
Model(gaussian)
[[Fit Statistics]]
# fitting method = leastsq
# function evals = 2503
# data points = 100
# variables = 3
chi-square = 2.13333145
reduced chi-square = 0.02199311
Akaike info crit = -378.748537
Bayesian info crit = -370.933026
[[Variables]]
amplitude: 45462508.4 +/- 1.6490e+11 (362709.92%) (init = 7.338596)
center: -603.281764 +/- 157294.736 (26073.18%) (init = -0.3159091)
sigma: 115.916638 +/- 15122.6351 (13046.13%) (init = 4.9)
fwhm: 272.962817 +/- 35611.0838 (13046.13%) == '2.3548200*sigma'
height: 156465.180 +/- 5.4710e+08 (349663.90%) == '0.3989423*amplitude/max(1e-15, sigma)'
[[Correlations]] (unreported correlations are < 0.100)
C(amplitude, center) = -1.000
C(center, sigma) = -1.000
C(amplitude, sigma) = 1.000
"""
view raw lmfit20.py hosted with ❤ by GitHub

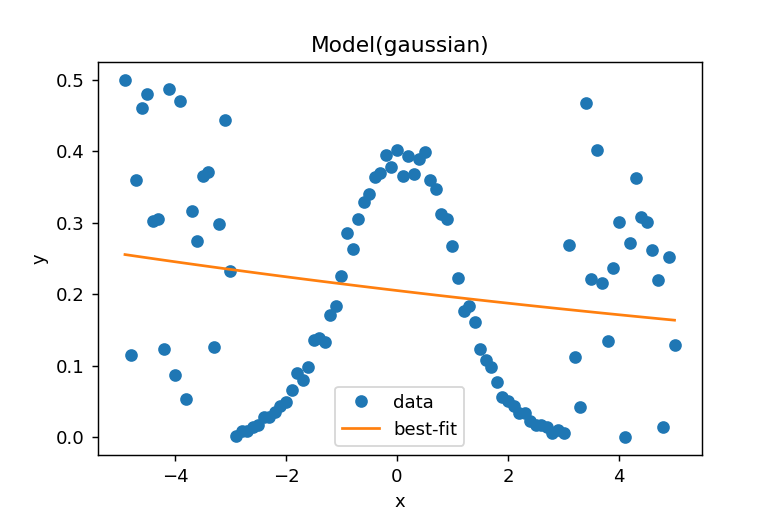
result.plot_fit()によりデータとフィッティングカーブが表示される。

fig, ax = plt.subplots(dpi=130)
result.plot_fit(ax=ax)
plt.savefig("lmfit20_3.png",dpi=130)
plt.show()
view raw lmfit20.py hosted with ❤ by GitHub

両端のデータに釣られて、うまくフィッティングできていないことがわかる。そこで重み付きによるフィッティングを行う。

重み配列の作成

weights=np.ones(100)*100
weights[:20]=20
weights[-20:]=20
weights
"""
array([ 20., 20., 20., 20., 20., 20., 20., 20., 20., 20., 20.,
20., 20., 20., 20., 20., 20., 20., 20., 20., 100., 100.,
100., 100., 100., 100., 100., 100., 100., 100., 100., 100., 100.,
100., 100., 100., 100., 100., 100., 100., 100., 100., 100., 100.,
100., 100., 100., 100., 100., 100., 100., 100., 100., 100., 100.,
100., 100., 100., 100., 100., 100., 100., 100., 100., 100., 100.,
100., 100., 100., 100., 100., 100., 100., 100., 100., 100., 100.,
100., 100., 100., 20., 20., 20., 20., 20., 20., 20., 20.,
20., 20., 20., 20., 20., 20., 20., 20., 20., 20., 20.,
20.])
"""
view raw lmfit20.py hosted with ❤ by GitHub

重みの配列を作成する。両端のデータがおかしいところは重みを小さくする。重み配列はデータと同じ形状でなければならない。

重みを利用したカーブフィット

params = model.guess(y, x=x)
result = model.fit(y, params, x=x,weights=weights)
view raw lmfit20.py hosted with ❤ by GitHub

model.fit()でweightsを指定することで重み付き最小2乗法近似ができる。

重みつきカーブフィットの結果の表示

print(result.fit_report())
"""
[[Model]]
Model(gaussian)
[[Fit Statistics]]
# fitting method = leastsq
# function evals = 40
# data points = 100
# variables = 3
chi-square = 1551.83004
reduced chi-square = 15.9982478
Akaike info crit = 280.202000
Bayesian info crit = 288.017510
[[Variables]]
amplitude: 0.99870955 +/- 0.02905524 (2.91%) (init = 7.338596)
center: 0.05738596 +/- 0.03327650 (57.99%) (init = -0.3159091)
sigma: 0.99105587 +/- 0.03332575 (3.36%) (init = 4.9)
fwhm: 2.33375819 +/- 0.07847613 (3.36%) == '2.3548200*sigma'
height: 0.40202323 +/- 0.01169331 (2.91%) == '0.3989423*amplitude/max(1e-15, sigma)'
[[Correlations]] (unreported correlations are < 0.100)
C(amplitude, sigma) = 0.578
"""
view raw lmfit20.py hosted with ❤ by GitHub

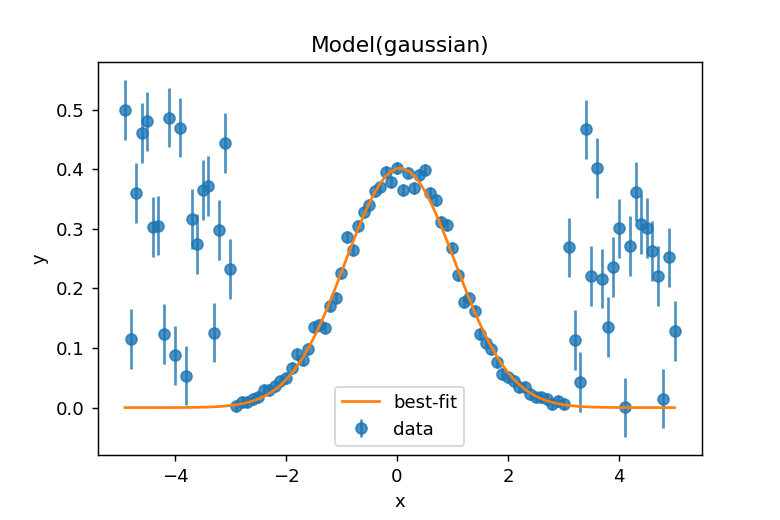
result.plot_fit()で結果を表示すると以下のようになる。

fig, ax = plt.subplots(dpi=130)
result.plot_fit(ax=ax,data_kws=dict(alpha=0.8),fit_kws=dict(zorder=13))
plt.savefig("lmfit20_4.png",dpi=130)
plt.show()
view raw lmfit20.py hosted with ❤ by GitHub

コードをダウンロード(.pyファイル)

コードをダウンロード(.ipynbファイル)

参考

Built-in Fitting Models in the models module — Non-Linear Least-Squares Minimization and Curve-Fitting for Python
numpy.random.Generator.normal — NumPy v2.2 Manual

コメント