はじめに
matplotlib mplot3dで作成する3Dグラフでアスペクト比を揃えるために、ax.set_aspect(‘equal’)とすると、NotImplementedErrorが出るようになった(matplotlib 3.1.0から)。下記サイトにその理由が書いてある。
API Changes — Matplotlib 3.1.0 documentation
3d plots with aspect='equal' ?? Issue #1077 ?? matplotlib/matplotlib
aspect='equal' argument is completely misused by axes3D. To verify: import matplotlib.pyplot as plt from mpl_toolkits im...
具体的には、以下のようになる。
ここでは、ax.set_aspect(‘equal’)を使わずにアスペクト比を揃える方法について検討した。
figsizeを変更
plt.figaspect(1)の場合
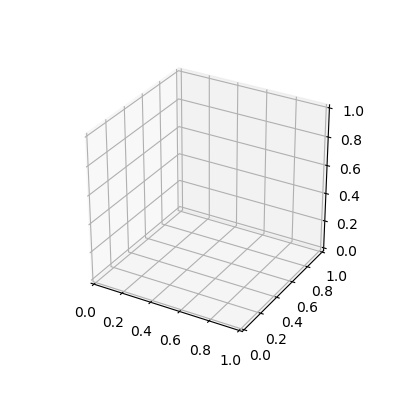
figsizeをplt.figaspect(1)とすることでfigの大きさ自体のアスペクト比が揃うので図のアスペクト比も揃うことになる。
plt.figaspect(1)の値としては(4,4)となる。
plt.figaspect(0.5)の場合
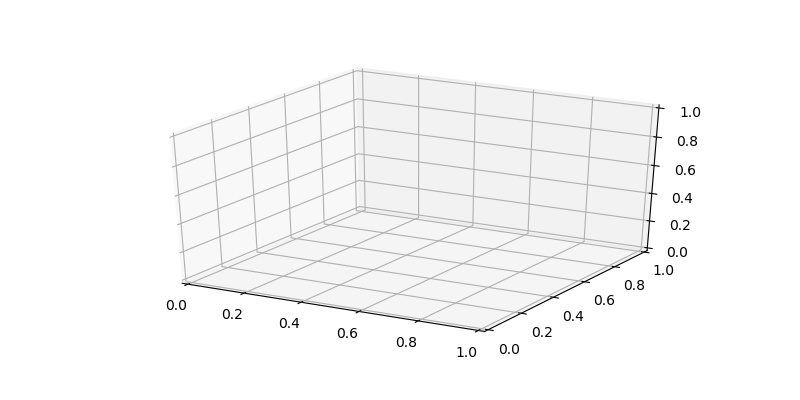
figsizeをplt.figaspect(0.5)とすることで横長の図となる。
plt.figaspect(0.5)の値としては(8,4)となります。
figsize=(6,6)の場合
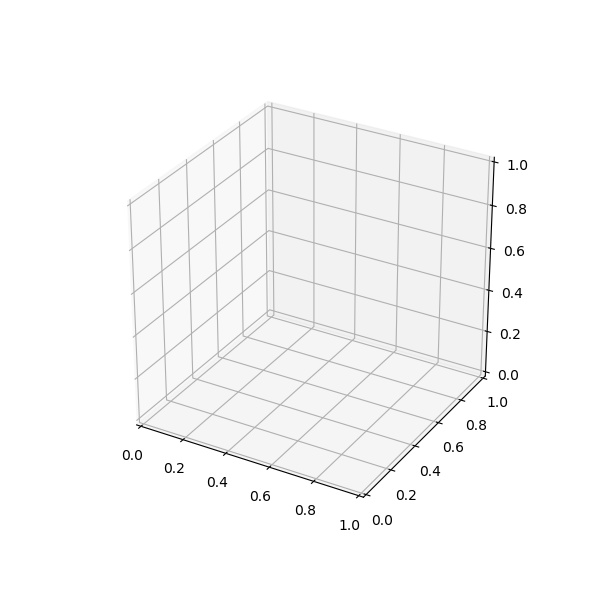
figsizeを直接指定することでもアスペクト比の揃った図が得られる。
axesのサイズを設定
add_axes
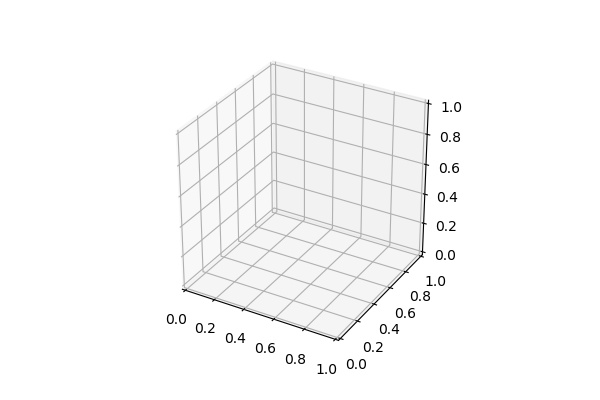
fig.add_axes()によりaxesの大きさを指定することによってもアスペクト比を揃えることができる。
get_figwidth,get_figheightで得られる値は以下の通りとなる。
set_box_aspectで設定
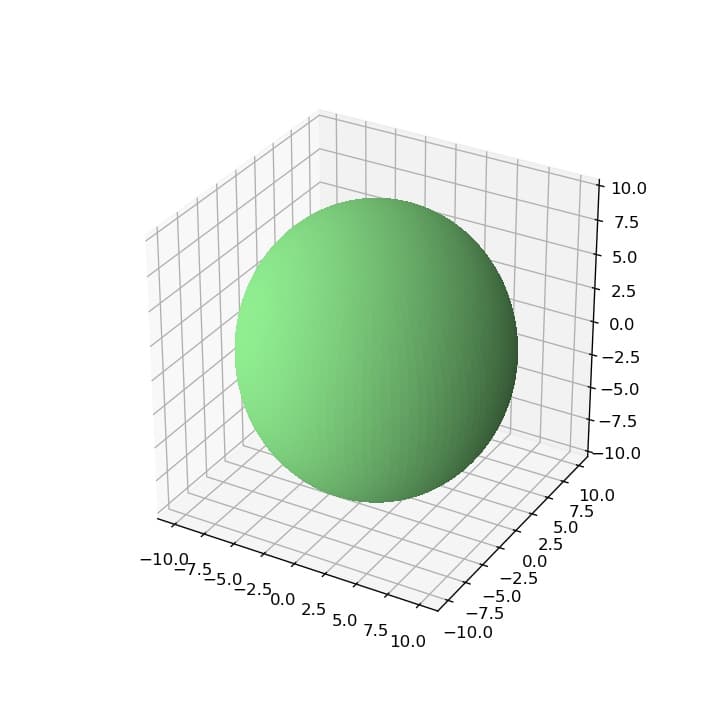
matplotlib3.3以降では、set_box_aspectにより3Dグラフのアスペクト比を変えることができる。
参考
matplotlibで図の縦横比に関するあれこれ - bettamodokiのブログ
matplotlibを用いて図を作成する際に, 縦横比をどうすれば変えられるのか聞かれたのであれこれ考えてみたが, 今ひとつ決定打が無い.方法1. Figure自体の縦横比を指定する. from matplotlib.figure as f...
mpl_toolkits.mplot3d.axes3d.Axes3D — Matplotlib 3.3.0 documentation

コメント