 matplotlib
 [matplotlib] 129. 3Dプロットでfill_between関数を使用する方法
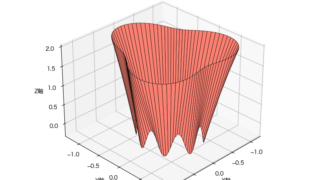
Matplotlibを使用した3Dグラフの塗りつぶし技術を解説する記事。fill_between関数を活用して3D曲線間の空間を視覚的に表現する方法とサンプルコードの詳細な解説を提供します。
matplotlib  matplotlib
  matplotlib
  ipywidgets
  matplotlib 3D
  matplotlib
  matplotlib
  ipywidgets