はじめに
本記事では、matplotlib を用いて数学的に美しいエンネパー曲面(Enneper surface)を3Dグラフとして表示する方法を解説します。エンネパー曲面は自己交差性を持つ極小曲面として知られています。
コード
解説
モジュールのインポートなど
バージョン
データの生成
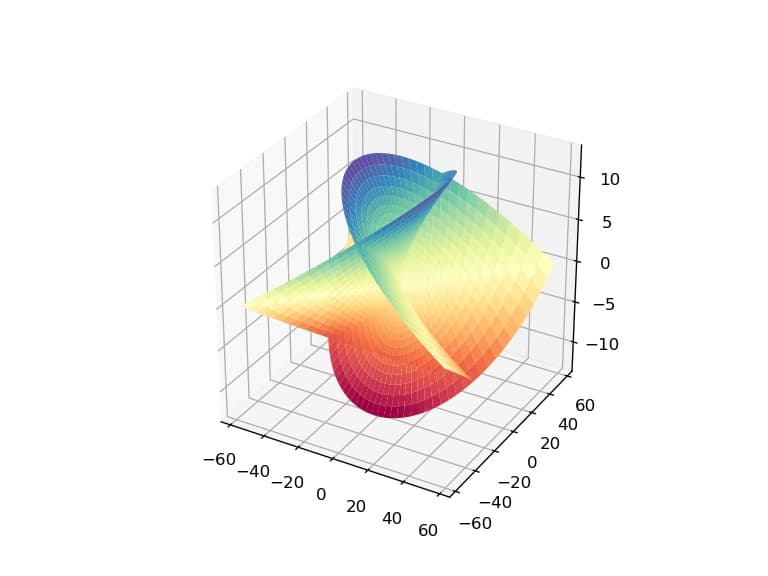
エンネパー曲面はパラメトリック方程式で表されます。
plot_surfaceによる曲面の表示
plot_surface関数を使用して表示すると以下のようになります。ax.set_box_aspect((1,1,1))を使用してアスペクト比を均等に設定しています。
回転アニメーションで表示
ax.view_initを変化させることで図を回転することができます。詳細は下記記事と同様にしました。
[matplotlib 3D] 14. 3Dグラフの回転アニメーション
matplotlibのmplot3dを使用して3Dグラフの回転アニメーションを作成する方法を解説します。動画として保存する手順や回転角度の制御など、3Dビジュアライゼーションを動的に表現するための基本テクニックを紹介します。
sabopy.com
2018.10.25
まとめ
本記事では、matplotlibを使ってエンネパー曲面を3Dグラフとして表示する方法を解説しました。Pythonとmatplotlibを用いることで、複雑な数学的曲面も簡単に可視化できることがわかります。ぜひ、パラメータを変更したり、別のカラーマップを試したりして、エンネパー曲面の探索を楽しんでください。
参考
エンネパー曲面 - Wikipedia
ja.wikipedia.org

コメント