はじめに
本記事では、matplotlibライブラリのstackplot関数を使用した積み上げ面グラフの作成方法について解説します。
コード

解説
モジュールのインポートなど
バージョン
データの生成
np.random.randint(1,5,6)で1〜5のランダムな整数を6個生成します。
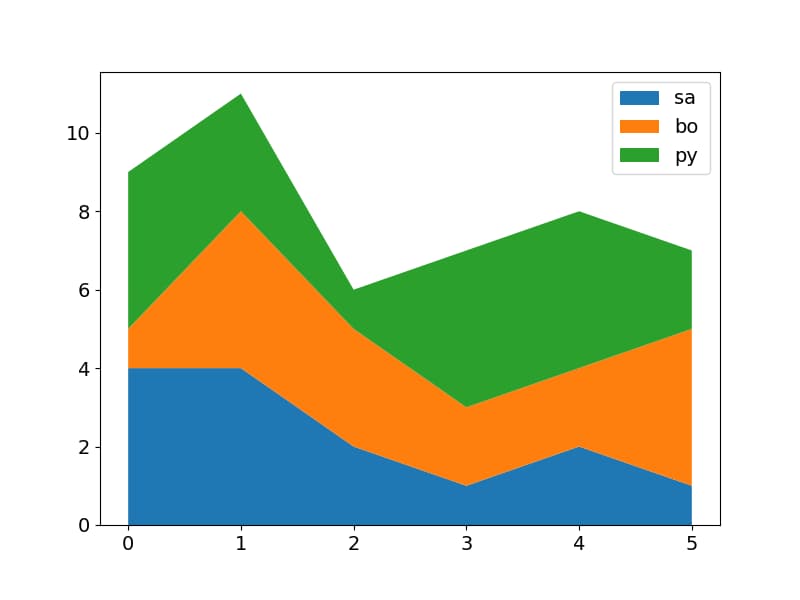
積み上げ面グラフの表示
ax.stackplot(x, y1, y2, y3)のように記述するだけで、簡単に積み上げ面グラフを作成できます。また、labelsを設定することで、legendを使って凡例を表示することも可能です。
yをまとめて積み上げ面グラフ
積み上げ面グラフは、np.vstack([y1, y2, y3])のようにyを一つにまとめることでも作成できます。
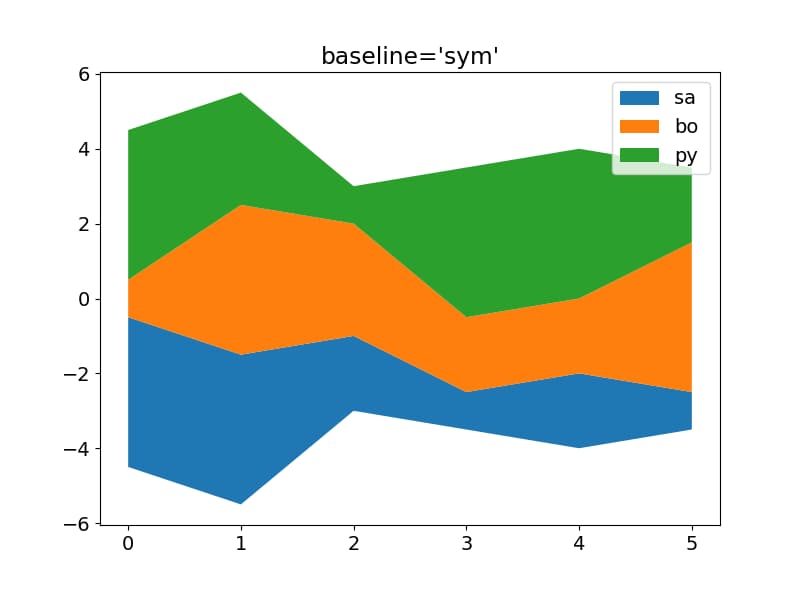
baseline=’sym’とした場合
ax.stackplot()にbaseline=’sym’を指定すると、0を中心とした対称的な積み上げ面グラフを作成できる。
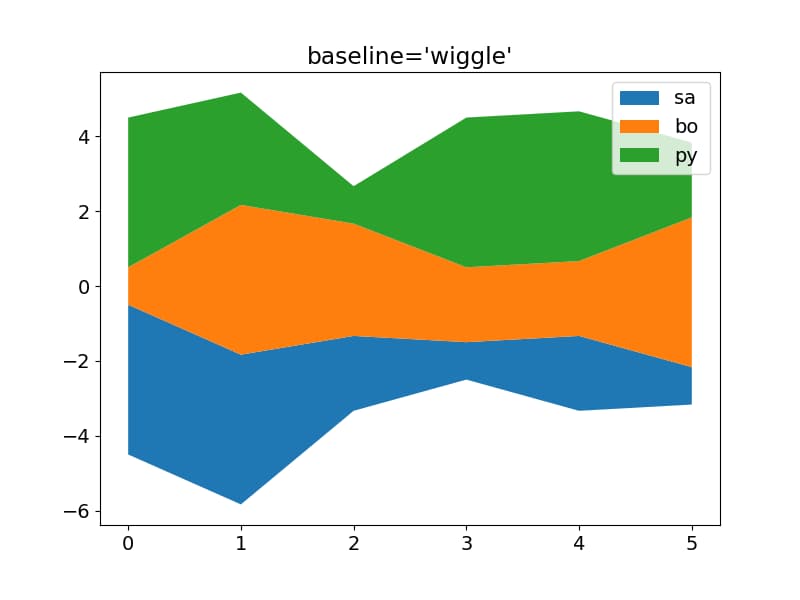
baseline=’wiggle’とした場合
ax.stackplot()でbaseline=’wiggle’とすることで二乗勾配の合計を最小化した積み上げ面グラフとなります。
まとめ
matplotlibのstackplot関数を使った積み上げ面グラフの作成方法について説明しました。基本的な使い方から、色の指定、ラベルの設定、凡例の追加まで解説し、実際のコード例も示しました。積み上げ面グラフは、時系列データの構成比の変化を視覚的に把握するのに適しており、様々なデータ分析シーンで活用できます。
参考


matplotlib.axes.Axes.stackplot — Matplotlib 3.10.8 documentation
matplotlib.org

Stackplots and streamgraphs — Matplotlib 3.10.8 documentation
matplotlib.org
コメント