はじめに
この記事ではmatplotlibのsubplots機能を使用して作成した複数のグラフに対して、supxlabelとsupylabel関数を使って共通のx軸・y軸ラベルを設定する方法を解説します。これにより、複数のサブプロットを持つ図において、個別に軸ラベルを設定する代わりに、全体に対して1つの軸ラベルを効率的に設定できます。
コード
解説
モジュールのインポートなど
バージョン
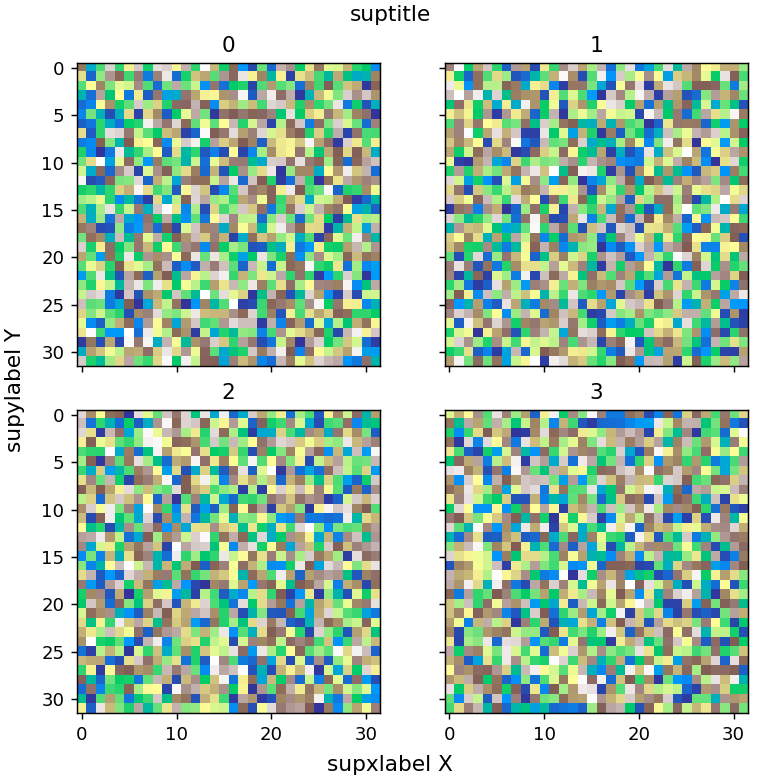
supxlabel,supylabelを用いた図の表示
共通の軸ラベルは
fig.supxlabel(‘supxlabel X’)のように設定できます。また、全体に共通するタイトルは
fig.suptitle(‘suptitle’)で表示できます。
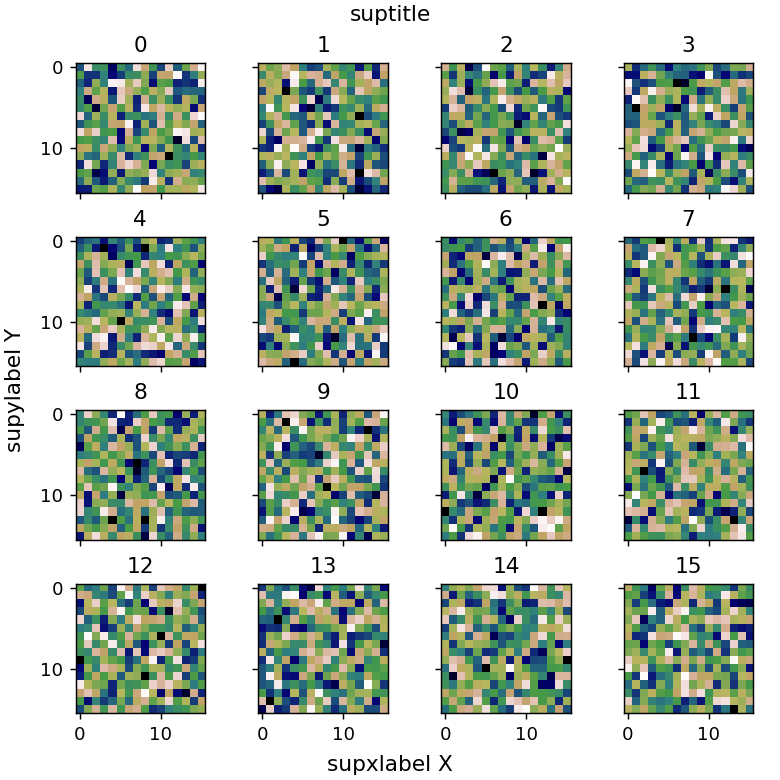
4 x 4 の図の場合
3 x 3の図の場合、縦、横それぞれの真ん中の図にラベルを設定すれば良いですが、4 x 4の図ではそれができないため、supxlabelとsupylabelの利用は非常に便利な方法です。
参考


matplotlib.figure — Matplotlib 3.10.8 documentation
matplotlib.org

matplotlib.figure — Matplotlib 3.10.8 documentation
matplotlib.org
コメント