Loading [MathJax]/jax/output/HTML-CSS/config.js

[matplotlib animation] 35. 田植え

matplotlib Animation

はじめに

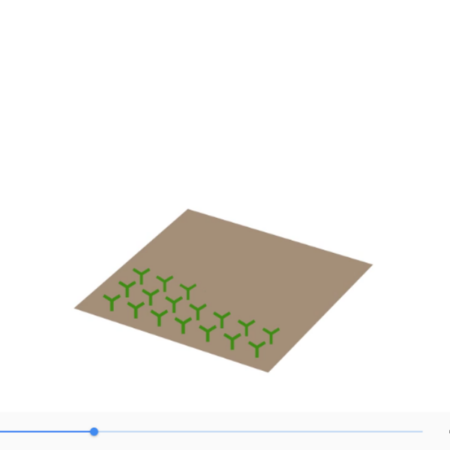
3Dグラフ上の2次元平面(田)にマーカー(苗)が順次出現するアニメーションについて解説する。

コード

%matplotlib inline
from mpl_toolkits.mplot3d import Axes3D
import matplotlib.pyplot as plt
import matplotlib.animation as animation
from IPython.display import HTML
import numpy as np
def update(num):
plot= [ax.plot(xx.ravel()[:2+num], yy.ravel()[:2+num], zz.ravel()[:2+num]+0.01,'1',
ms=16,markeredgewidth=2,color='lime')]
# Attaching 3D axis to the figure
fig = plt.figure(figsize=(7,7))
ax = fig.gca(projection='3d')
#ax.set_aspect('equal')
ax.axis('off')
ax.set_xlim(.1,.9)
ax.set_ylim(.1,.9)
ax.set_zlim(.1,.9)
# naes to plot in 3D
x,y = np.meshgrid(np.linspace(0.1,0.9,9),np.linspace(0.1,0.9,9))
z = np.zeros((9,9))
xx,yy = np.meshgrid(np.linspace(0.2,0.8,7),np.linspace(0.2,0.8,7))
zz = np.zeros((7,7))
ax.plot_surface(x, y, z,color='peru',alpha=.6,rstride=9,cstride=9)
plot= [ax.plot(xx.ravel()[:1], yy.ravel()[:1], zz.ravel()[:1]+0.01,'1',ms=16,markeredgewidth=2,color='lime')]
ani = animation.FuncAnimation(fig, update, 48,interval=105)
HTML(ani.to_html5_video())
#dpi=150
#ani.save('taue.mp4', writer="ffmpeg",dpi=dpi)
view raw taue_anim.py hosted with ❤ by GitHub

解説

モジュールのインポート

%matplotlib inline
from mpl_toolkits.mplot3d import Axes3D
import matplotlib.pyplot as plt
import matplotlib.animation as animation
from IPython.display import HTML
import numpy as np
view raw taue_anim.py hosted with ❤ by GitHub

図の作成、軸の設定

# Attaching 3D axis to the figure
fig = plt.figure(figsize=(7,7))
ax = fig.gca(projection='3d')
#ax.set_aspect('equal')
ax.axis('off')
ax.set_xlim(.1,.9)
ax.set_ylim(.1,.9)
ax.set_zlim(.1,.9)
view raw taue_anim.py hosted with ❤ by GitHub

データの生成

x,y = np.meshgrid(np.linspace(0.1,0.9,9),np.linspace(0.1,0.9,9))
z = np.zeros((9,9))
xx,yy = np.meshgrid(np.linspace(0.2,0.8,7),np.linspace(0.2,0.8,7))
zz = np.zeros((7,7))
view raw taue_anim.py hosted with ❤ by GitHub

x,y,zは田全体、xx,yy,zzは苗を植える場所に設定。

アニメーション開始前の図の設定

ax.plot_surface(x, y, z,color='peru',alpha=.6,rstride=9,cstride=9)
plot= [ax.plot(xx.ravel()[:1], yy.ravel()[:1], zz.ravel()[:1]+0.01,'1',ms=16,markeredgewidth=2,color='lime')]
view raw taue_anim.py hosted with ❤ by GitHub

ax.plot_surface(x,y,z)で2次元平面を表示、rstride, cstrideを9とすることで線がでないようにしている。
ax.plot(xx.ravel()[:1], yy.ravel()[:1], zz.ravel()[:1]+0.01)で散布図をプロット。’1’とすることでYのようなマーカーが表示される。

アニメーションの設定

def update(num):
plot= [ax.plot(xx.ravel()[:2+num], yy.ravel()[:2+num], zz.ravel()[:2+num]+0.01,'1',
ms=16,markeredgewidth=2,color='lime')]
view raw taue_anim.py hosted with ❤ by GitHub

散布図でデータを順次プロットしていく設定。

アニメーションの表示

ani = animation.FuncAnimation(fig, update, 48,interval=105)
HTML(ani.to_html5_video())
view raw taue_anim.py hosted with ❤ by GitHub

FuncAnimationでanimationの表示する。updateを48step実行してアニメーションとする。intervalは105 ms なので5秒ほどのアニメーションとなる。
HTML(ani.to_html5_video())でjupyter notebook上にアニメーションを表示できる。

コードをダウンロード(.pyファイル)

コードをダウンロード(.ipynbファイル)

参考

matplotlib.animation.FuncAnimation — Matplotlib 3.9.3 documentation

コメント