はじめに
この記事では、matplotlibのFuncAnimationを使用して、subdivide_polygon関数のdegree=1, 2, 3における実行回数の変化をアニメーション化する方法について説明します。subdivide_polygon関数は多角形を細分化するもので、degreeパラメータによって細分化の度合いが変わります。このアニメーションを通じて、各degreeの値における計算量の違いを視覚的に理解することができます。
コード
解説
モジュールのインポート
図形データの生成
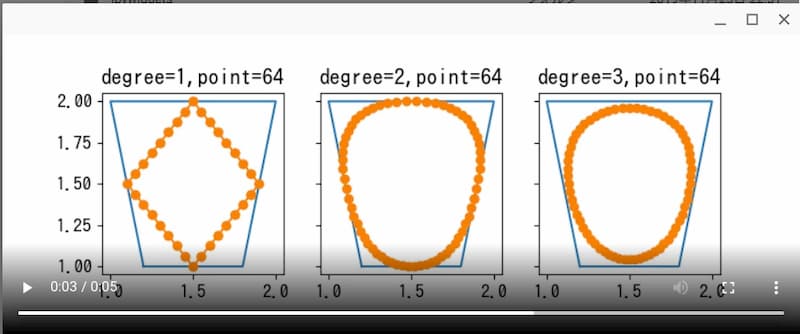
閉じた台形状の図形データとなります。
図の作成
plt.subplots(1,3)を使用して1行3列の図を作成します。各図に対してa.set_aspect(‘equal’)を適用してアスペクト比を揃え、a.plot(shape1[:, 0], shape1[:, 1])で元データの図形を表示します。
アニメーションの設定
空のリストの生成
アニメーション関数内で作成した図をいれるリストです。
アニメーションの関数
古いプロットを消す
図形の細分化と表示
new_shape1~3に所定の回数のsubdivide_polygonを適用し、その結果をplotした後、.append()メソッドでリストに格納します。subdivide_polygonの詳細については、以下で解説しています。

タイトルの表示
ax[0].set_title(“degree=1,point=”+str(len(new_shape1)-1))を使用して、タイトルにdegreeの値と細分化したデータのポイント数を表示します。
アニメーションの表示
HTML(ani.to_html5_video())とすればjupyter notebook上にアニメーションを表示できます。
コードをダウンロード(.pyファイル) コードをダウンロード(.ipynbファイル)まとめ
matplotlibのFuncAnimationを使用することで、subdivide_polygon関数の各degreeにおける実行回数の変化を動的に可視化できることがわかりました。特にdegreeの値が大きくなるにつれて、実行回数が指数関数的に増加する様子が明確に示されており、アルゴリズムの計算量を直感的に理解するのに役立ちます。
参考
コメント