はじめに
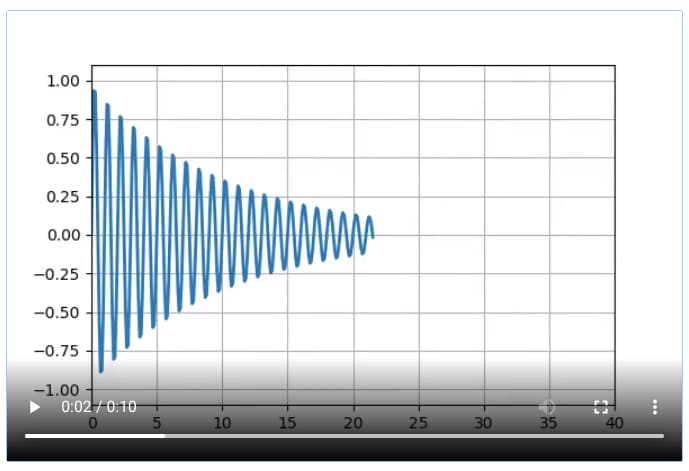
この記事はMatplotlibのアニメーション機能における軸の更新方法について解説しています。特に減衰現象のシミュレーションを例として、時間とともに変化するグラフの軸を動的に更新する方法を説明しています。コードサンプルとともに、減衰曲線の描画方法やアニメーションの設定手順が詳細に示されています。
コード
このコードをJupyter Notebookで実行しても軸が更新されません。
xmaxは160に設定されているにもかかわらず、
ax.figure.canvas.draw()が正常に機能していないようです。
問題の原因はdata_gen関数にあると考え、data_genを使わない代替コードを以下に作成しました。
解説
moduleのインポート
import numpy as np
import matplotlib.pyplot as plt
import matplotlib.animation as animation
from IPython.display import HTML
HTMLはJupyter Notebook上にアニメーションを表示するためにインポートします。
fig, plotの作成
fig, ax = plt.subplots()
line, = ax.plot([], [], lw=2)
xdata, ydata = [], []
figとaxの設定をします。
line,は空のデータでlw(線幅)を2に設定してプロットします。
xdataとydataはそれぞれ空のリストとして初期化します。
データの生成
t=np.linspace(0,100,1000)
y=np.sin(2*np.pi*t) * np.exp(-t/10.)
data_gen関数から抽出したデータです。
tは0から100までの範囲を1000等分した配列です。
yはこのt値を用いて計算した結果値です。
アニメーションの初期設定
def init():
    ax.set_ylim(-1.1, 1.1)
    ax.set_xlim(0, 10)
    del xdata[:]
    del ydata[:]
    line.set_data(xdata, ydata)
    return line,
set_xlim、set_ylimでx軸とy軸の表示範囲を設定します。
del xdata[:]で、xdataに既存のデータがある場合に備えてクリアします。
line.set_data(xdata, ydata)で線グラフにデータをセットします。
return line,でlineオブジェクトを返します。注意点として、lineの後にカンマが必要です。
アニメーションの設定
def run(i,t,y):
    # update the data
    xdata.append(t[i])
    ydata.append(y[i])
    line.set_data(xdata, ydata)
.append でxとyにデータを順次追加していきます。
.set_data でline(プロット)にデータを設定していきます。
軸の更新
    xmin, xmax = ax.get_xlim()
    if t >= xmax:
        ax.set_xlim(xmin, 2*xmax)
現在のxminとxmaxを.get_xlim()メソッドで取得します。
tの値がxmaxを超えた場合、x軸の最大値をxmax×2に拡張して表示範囲を調整します。
アニメーションの表示
ani = animation.FuncAnimation(fig, run, 1000, fargs=(t,y), blit=False, interval=10,
                              repeat=False, init_func=init)
HTML(ani.to_html5_video())
FuncAnimationを使用してアニメーションを表示します。framesが1000でintervalが10のため、全体で10秒のアニメーションになります。repeat=Falseを設定することで、アニメーションは一度だけ再生され繰り返しません。また、init_funcで初期設定を行います。
コードをダウンロード(.pyファイル) コードをダウンロード(.ipynbファイル)まとめ
Matplotlibを使用した減衰現象のアニメーション表示において、軸の更新は重要な要素です。FuncAnimationクラスとset_xlimやset_ylimメソッドを組み合わせることで、データの変化に合わせて軸の範囲を動的に調整できます。これにより、減衰曲線のような時間変化するデータを効果的に可視化することが可能になります。
参考

コメント
[…] […]