はじめに
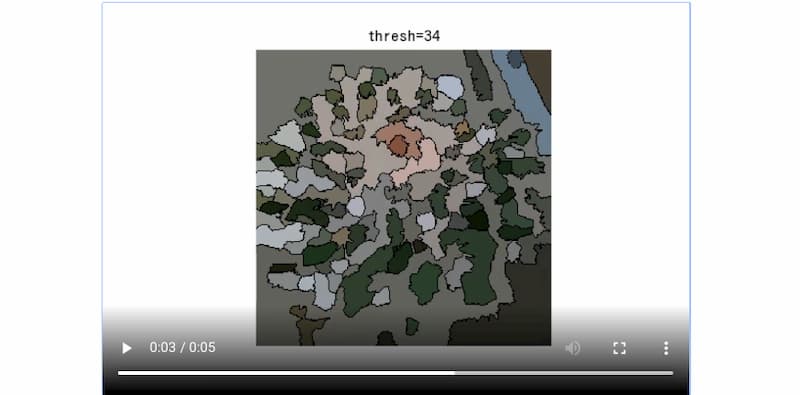
この記事では、matplotlib の FuncAnimation を使用して、skimage.feature graph の merge_hierarchical 関数のパラメータ thresh を変化させた際の画像変化をアニメーションで表示する方法について解説しています。隣接領域グラフ(RAG)を用いて、色の似ている領域を結合する処理を視覚的に表現します。
コード
解説
隣接領域グラフ(RAG)による色が似ている領域の結合
skimage.feature.graph の merge_hierarchical 関数による隣接領域グラフ(RAG)を用いた、色が似ている領域の結合については下記で説明しました。
[scikit-image] 62. 隣接領域グラフ(RAG)による色が似ている領域の結合(skimage.feature graph merge_hierarchical)
scikit-imageライブラリのskimage.feature graphモジュールのmerge_hierarchical関数を使用して、画像の隣接領域グラフ(RAG)を構築し、色の類似した領域を効率的に結合する方法について解説します。
sabopy.com
2020.01.10
アニメーションの設定
アニメーション以外のコードは上記記事と同じなので省略します。ax.cla()でまず画像をクリアし、thresh=2numとしたmerge_hierarchical画像を順次表示していきます。ax.set_title(“thresh=”+str(2num))でタイトルに用いたthreshの値を表示します。
アニメーションの表示
HTML(ani.to_html5_video())により、jupyter notebook またはjupyter lab上にアニメーションを表示できます。
まとめ
画像処理において領域の統合(セグメンテーション)は重要な技術であり、隣接領域グラフを用いた手法は効果的です。閾値を変えることで統合される領域が変化する様子をアニメーションで可視化することで、適切なパラメータ設定の参考になります。
参考
[scikit-image] 62. 隣接領域グラフ(RAG)による色が似ている領域の結合(skimage.feature graph merge_hierarchical)
scikit-imageライブラリのskimage.feature graphモジュールのmerge_hierarchical関数を使用して、画像の隣接領域グラフ(RAG)を構築し、色の類似した領域を効率的に結合する方法について解説します。
sabopy.com
2020.01.10

Page not found · GitHub Pages
scikit-image.org

matplotlib.animation.FuncAnimation — Matplotlib 3.11.0 documentation
matplotlib.org
コメント