はじめに
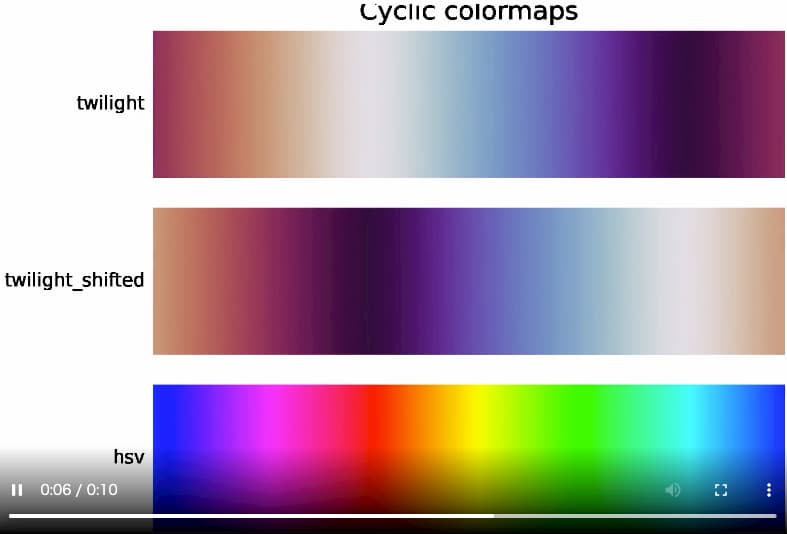
matplotlibのFuncAnimationを使用して、cyclicなカラーマップ(cmap)の循環アニメーションを作成する方法について解説します。同じ色で開始して終了するカラーマップを使って、滑らかに色が変化するアニメーションを実現する手法を紹介します。
コード
解説
モジュールのインポート
バージョン
データの生成
gradientはimshowで表示するデータとなります。
図の表示
図は下記記事のコードと同様にして表示しました。

Choosing Colormaps in Matplotlib — Matplotlib 3.1.0 documentation
matplotlib.org
アニメーションの設定
set_xlimでx軸の表示範囲を変えることで動かします。
アニメーションの表示
FuncAnimationでアニメーションを表示します。frame数を256、intervalを40msに設定することで、約10秒の滑らかなアニメーションを作成できます。
HTML(ani.to_html5_video())を使用すると、Jupyter NotebookやJupyter Lab上に直接アニメーションを表示できます。
また、ani.save(‘ファイル名’, writer=”ffmpeg”, dpi=250)を実行することで、高画質なMP4形式でアニメーションを保存することも可能です。
コードをダウンロード(.pyファイル) コードをダウンロード(.ipynbファイル)まとめ
matplotlibのFuncAnimationを活用することで、cyclicなカラーマップの特性を生かした循環アニメーションを作成できます。同じ色で開始・終了するカラーマップを選択し、適切なフレーム設定を行うことで、連続的に色が変化する視覚的に魅力的なアニメーションが実現できます。
参考
Choosing Colormaps in Matplotlib — Matplotlib 3.1.0 documentation
matplotlib.org
コメント